Figure 4. Time-course analysis of the cellular trafficking of myocilin. A: HTM cells transduced with Ad-myocilin-GFP at an MOI of 10 pfu were pulse labeled with [35S]methionine and chased for the times indicated. After chase, the GFP fusion protein in the equal amount of cell lysates (~5
μg/well) and culture media were immunoprecipitated with anti-GFP antibody, resolved on SDS–PAGE, and then subjected to autoradiography.
Each experiment was performed three times with similar results. B: HTM cells transduced with Ad-myocilin-GFP (upper panel) or Ad- stromelysin-GFP (lower panel) at the indicated MOI were pulse
labeled and chased for 4 h. The cells (C) and culture media (M) were separately harvested and processed the same as in A. Each experiment was performed two times with identical results. The bands resolved at approximately 68 kDa might be degraded
products of stromelysin-GFP.
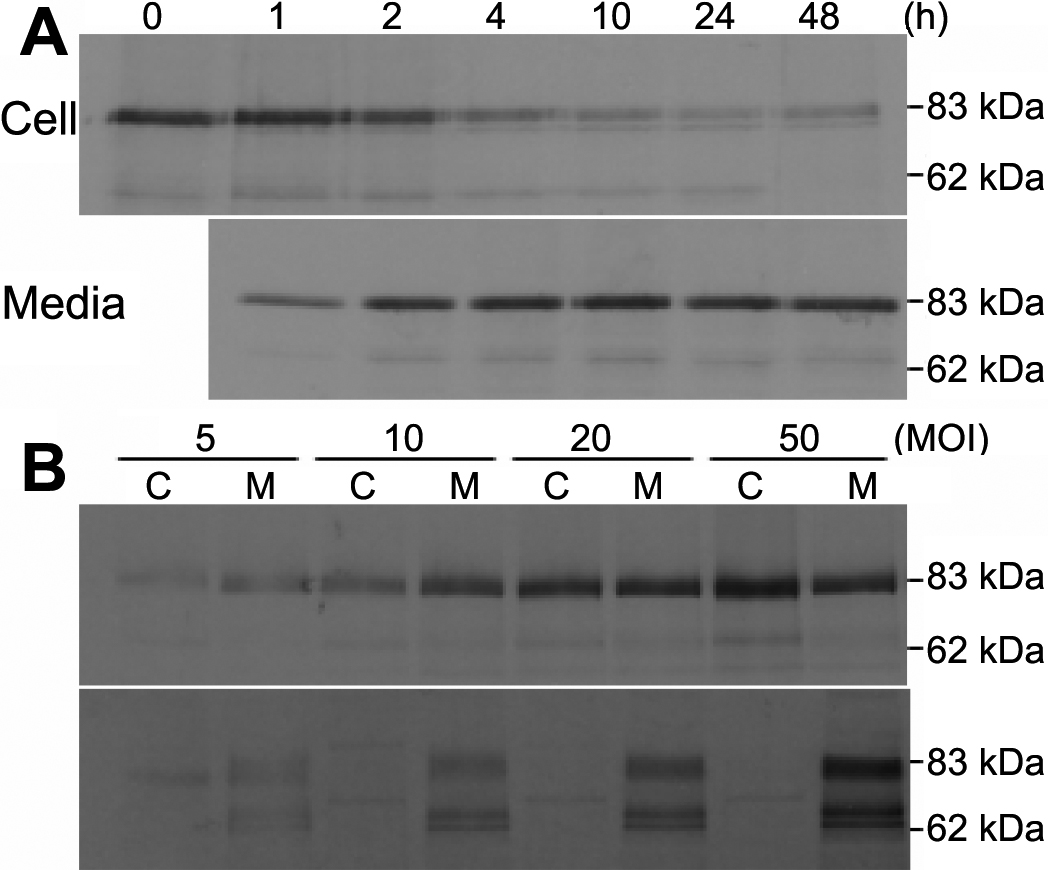
 Figure 4 of
Sohn, Mol Vis 2009; 15:545-556.
Figure 4 of
Sohn, Mol Vis 2009; 15:545-556.