Figure 7. Fluctuation of miR-182 target gene expression in the KO and wild-type mice. A: The Z ratios for genes were calculated between the KO and wild-type mice and the genes were classified into five groups.
The average frequencies of the 3′ UTR sequences targeted by miR-182 were calculated in each group and the fold enrichment
compared with all of the genes was obtained. Four different complementary sequences were used to analyze the potential miR-182
5′ seeds: n2–6 (GCCAA), n2–7 (TGCCAA), n1–7 (TGCCAAA), n1–8 (TTGCCAAA). B: The activity change (AC) scores of 398 miRNAs were calculated using the signal log ratios of genes from the wild-type and
KO mice. The AC scores of miR-182 (−6.16) is marked with a red bar.
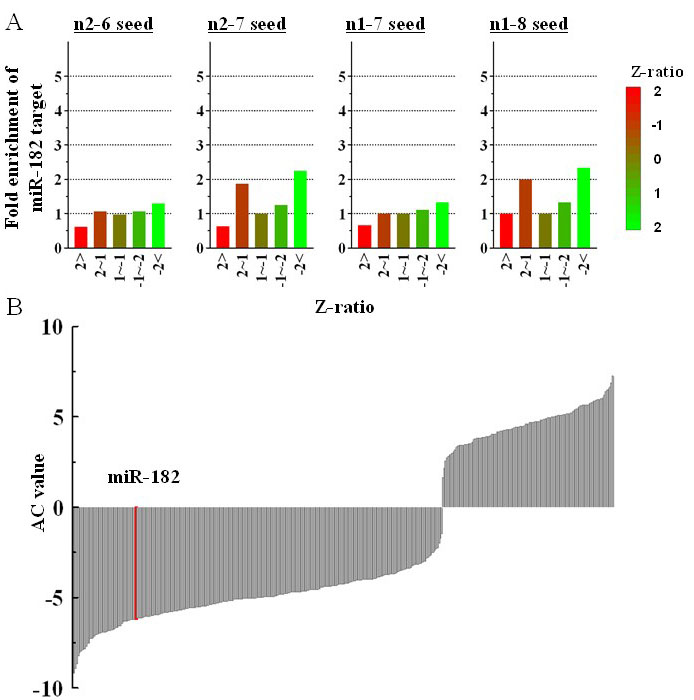
 Figure 7 of
Jin, Mol Vis 2009; 15:523-533.
Figure 7 of
Jin, Mol Vis 2009; 15:523-533.