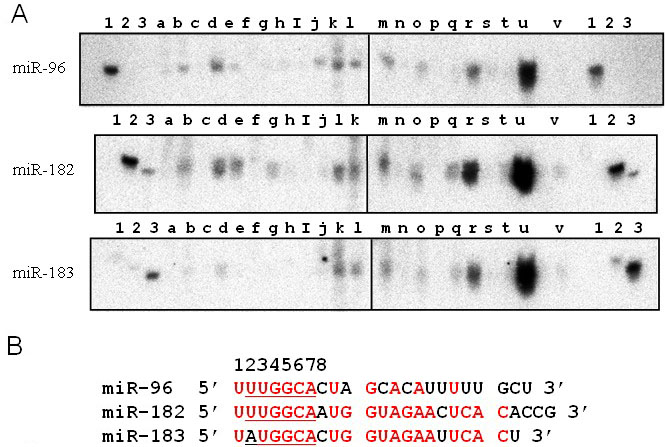
Figure 1. Tissue distribution of miR-96, miR-182, and miR-183 in the mouse. Expression levels of miR-96, miR-182, and miR-183 in lymph
node (lane a), skin (b), skeletal muscle (c), white fat (d), brown fat (e), liver (f), kidney (g), adrenal gland (h), spleen
(i), testis (j), stomach (k), small intestine (l), large intestine (m), thymus (n), lung (o), cardiac ventricle (p), thyroid
gland (q), submandibular gland (r), cerebrum (s), cerebellum (t), and eye (u) tissues of wild-type mice were analyzed by northern
blotting. Expression levels of miR-182 in fibroblasts isolated from normal skin were also analyzed (v). Synthetic miR-96 (lane
1), miR-182 (lane 2), and miR-183 (lane 3) were used as controls.
B:Sequences of miR-96, miR-182, and miR-183 are shown. Nucleotides that are identical between miR-182 and miR-96, and miR-182 and miR-183
are denoted in red. Numbers above the sequences indicate the nucleotide position from the 5′ end. The underlined sequences
represent the positions of the 2–7 seed region.
 Figure 1 of
Jin, Mol Vis 2009; 15:523-533.
Figure 1 of
Jin, Mol Vis 2009; 15:523-533.