Figure 3. Arylsulfatase activity of
cellular extracts. A: Cellular extracts were analyzed with
western blot. Transfected were 5 μg ARSA-FLAG (lanes 1 and 2),
8 μg ARSI-FLAG (lanes 3 and 4), and 1 μg SUMF1-FLAG
(lanes 2 and 4) into ARPE-19 cells .The transfected cells were cultured
in media for 72 h. The amount of the loaded sample was 10 μg protein
for ARSA and 12.5 μg protein for ARSI. B: The ARS activity of
ARSA-FLAG was measured at pH 5.0 using 0.5 mM 4-MUS as a substrate. C:
The ARS activity of ARSI-FLAG was measured at pH 5.6, using 5 mM 4-MUS
as a substrate. The activity was calculated as the value per mg of
cellular protein in each fraction. D: The pH dependence of ARS
activities was shown. The ARS activities in B, C, and D
give the means of three independent experiments. Bars indicate standard
deviations. The error bars in B were omitted because the
differences between samples were obvious.
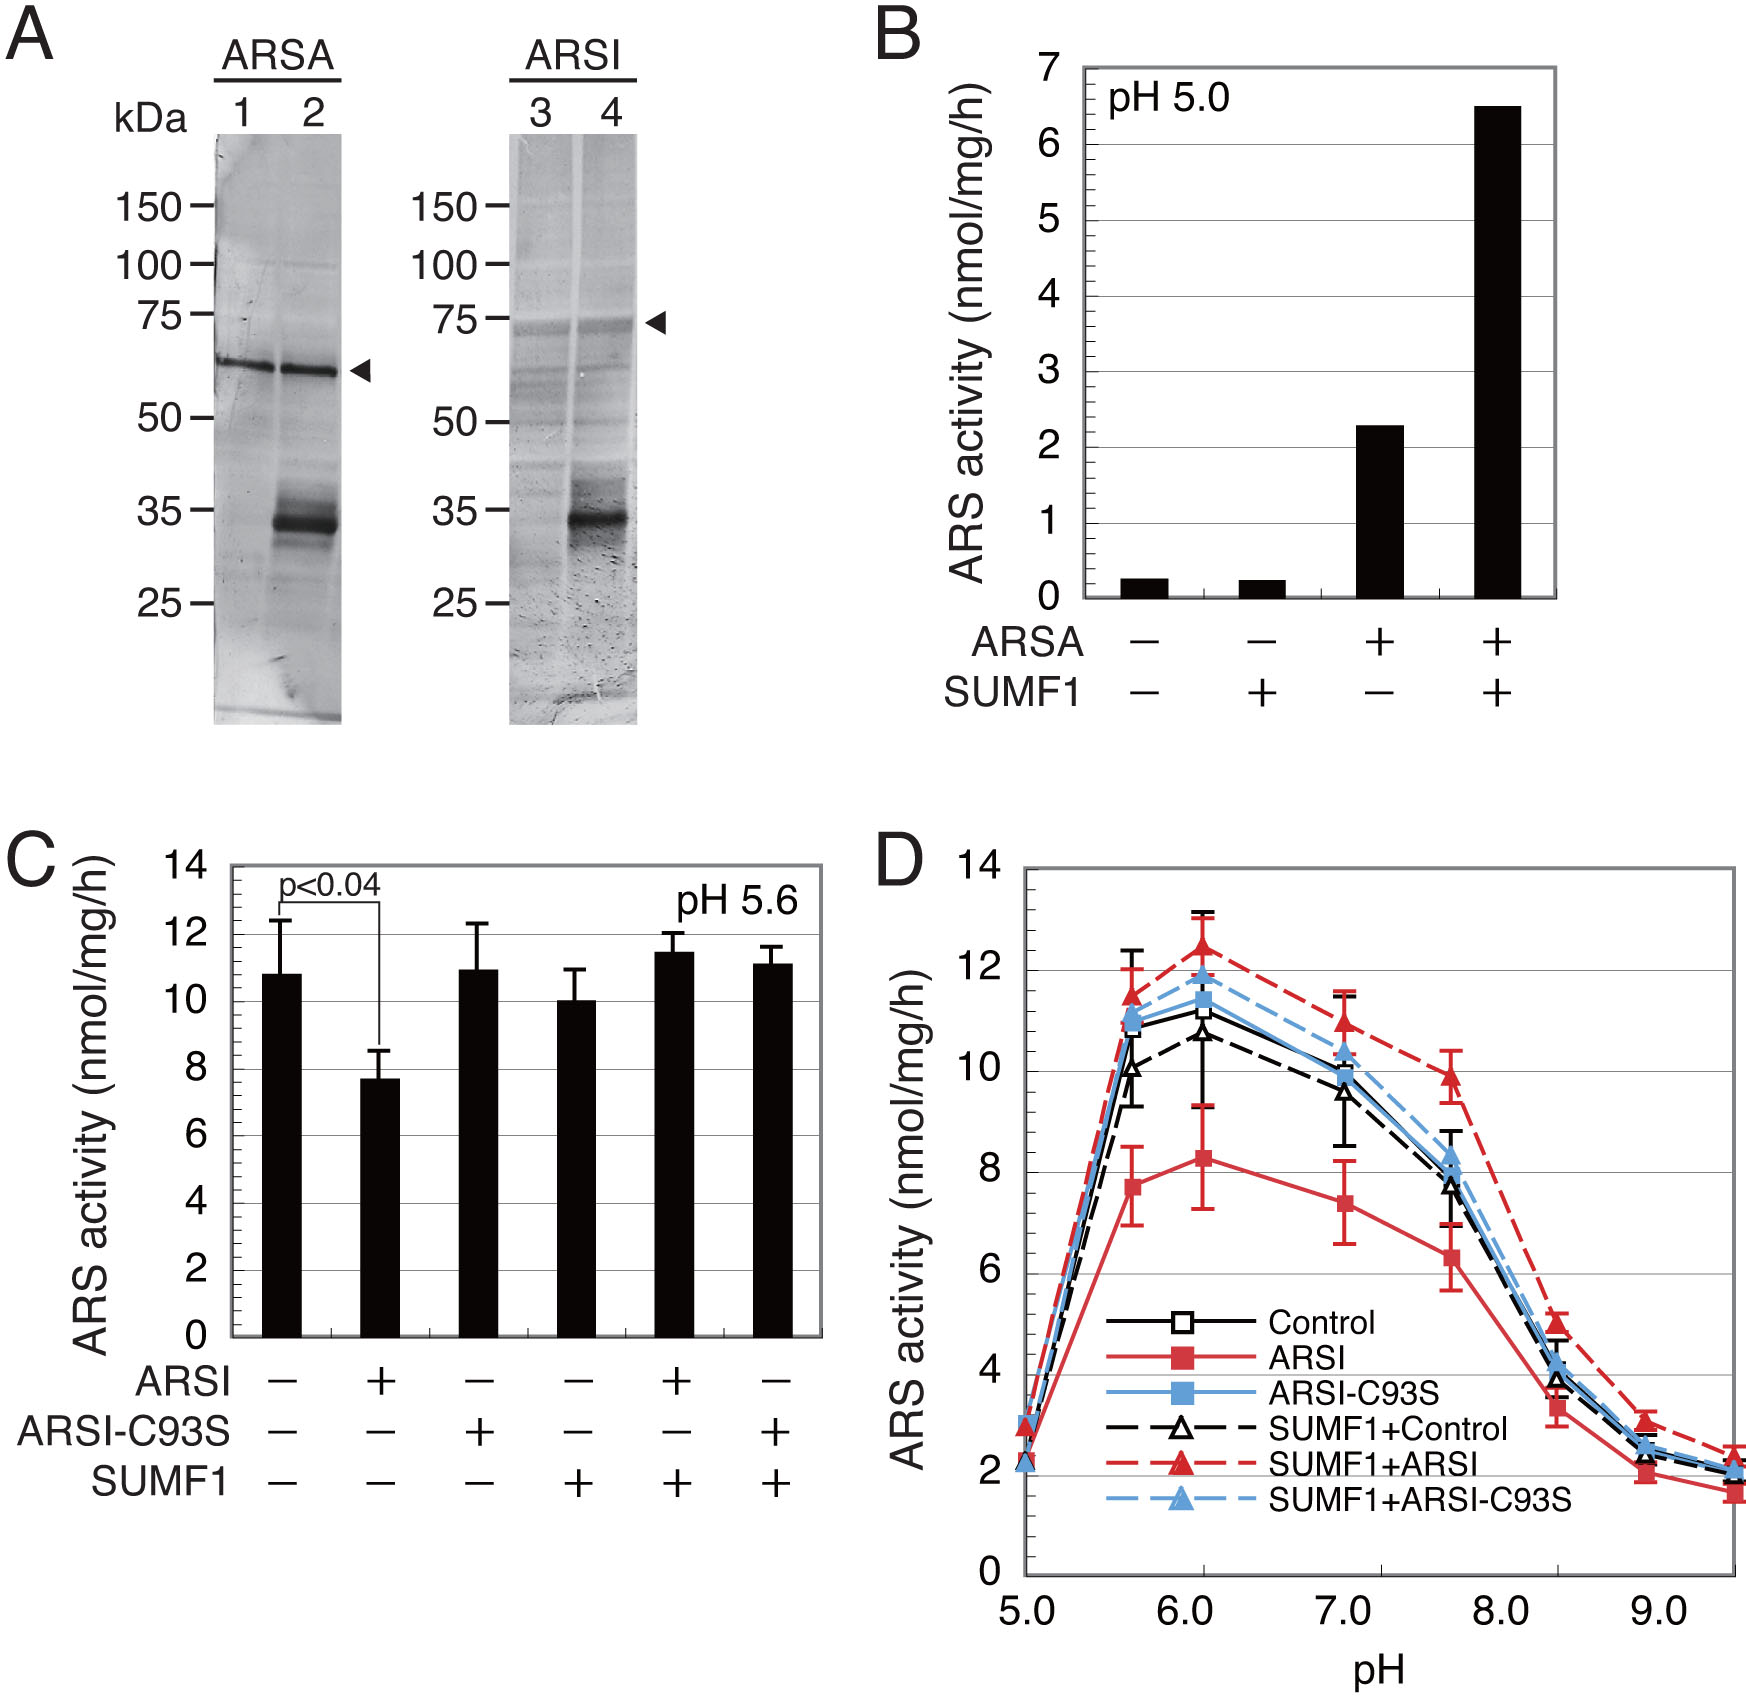
 Figure 3 of Oshikawa, Mol Vis 2009; 15:482-494.