Figure 3. TGF-β, PAI-1, and Id2
expressions. Expression of TGF-β1 in the conditioned medium of TR-MUL5
cells (MUL-CM) (A) and modulation of PAI-1 (B)
and Id2 (C) mRNA expressions by recombinant human TGF-β1
(rhTGF-β1) and MUL-CM in TR-iBRB2 cells. A: The expression of
TGF-β1 was determined by immunoblot analysis. B, C: The
expression levels of PAI-1 and Id2 mRNA were determined
by quantitative real-time PCR analysis and normalized to β-actin
mRNA expression. Each column represents the mean±SEM (n=4–12). Asterisk
represents p<0.01, significantly different from the control.
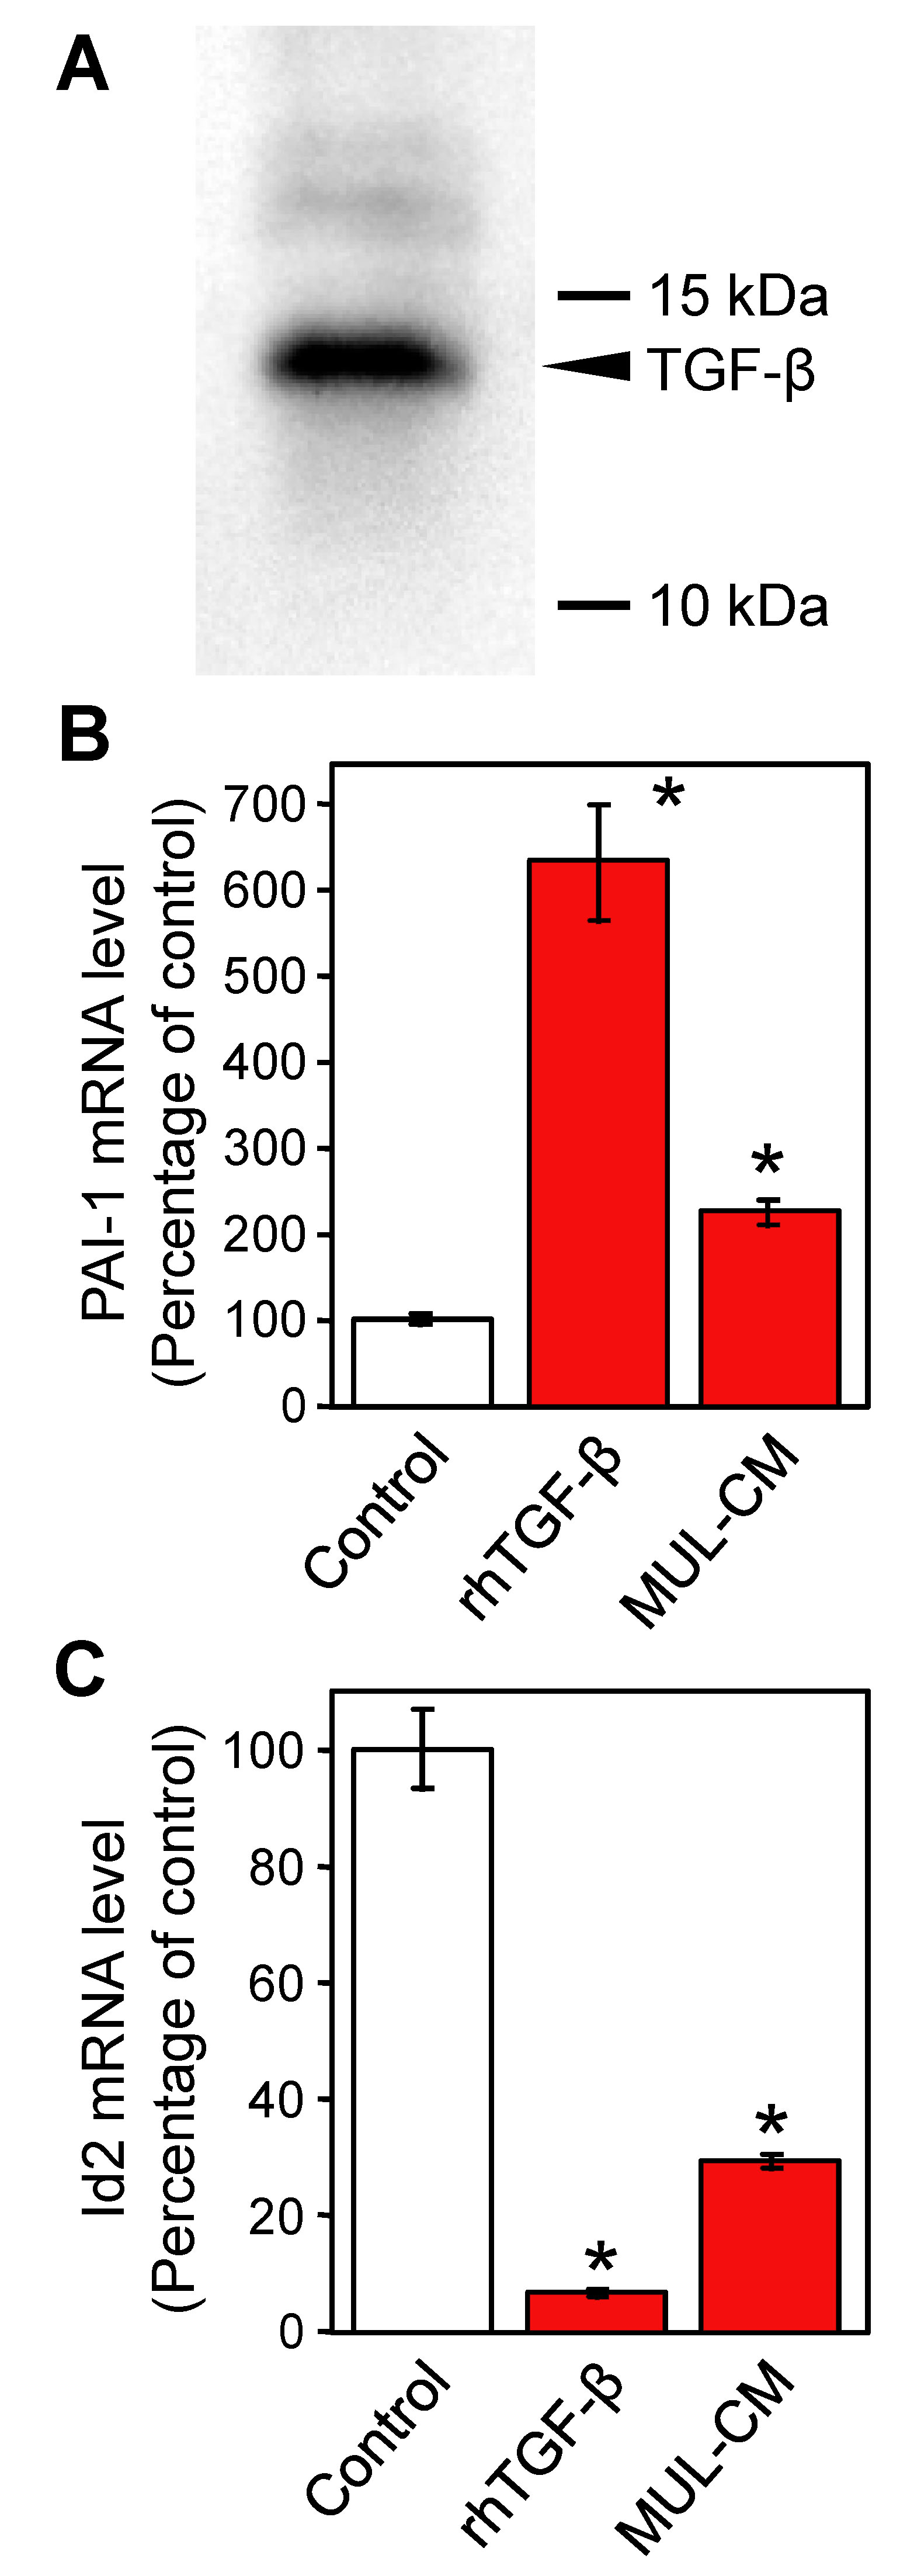
 Figure 3 of Abukawa, Mol Vis 2009; 15:451-457.