Figure 9. Changes in GFAP expression after PEDF transfection. A,B: Reduced GFAP expression in DBA/2J mice retina and optic nerve, respectively, 4 months after AAV-PEDF transfection. C: Graphical representation of 3 independent experiments in A and B, normalized with actin loading control. As compared with AAV-GFP control, AAV-PEDF transduced mice show significantly reduced
expression of GFAP in retina and optic nerve. ON: optic nerve. Statistical analysis for these experiments was performed using
unpaired Student’s t-test (the asterisk indicates a p<0.05).
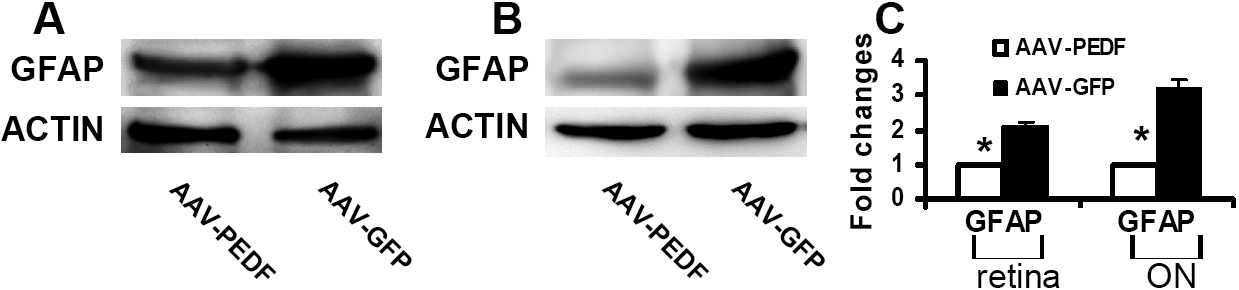
 Figure 9 of
Zhou, Mol Vis 2009; 15:438-450.
Figure 9 of
Zhou, Mol Vis 2009; 15:438-450.