Figure 2. Reduced PEDF gene and protein expression in retina and optic nerve from DBA/2J mice. A: RT–PCR shows reduced PEDF gene expression in th retina of DBA/2J mice at 3 and 6 months of age. B: Graphical representation of the RT–PCR data in A after normalization with GAPDH loading control (mean±SD, n=3). C: Reduced PEDF protein expression in retina of DBA/2J mice with age, as detected by western blot. D: Densitometric analysis of PEDF protein expression in 3 independent experiments from C after normalization with actin loading control. (n=3). E: Western blot analysis shows decreased PEDF protein expression in optic nerve from DBA/2J mice at 6 months old. F: Densitometric analysis of PEDF protein expression in 3 independent experiments, after normalization to actin loading control.
Statistical analyses for this experiment was performed using ANOVA with the Scheffé multiple comparison test (the asterisk
indicates a p<0.05).
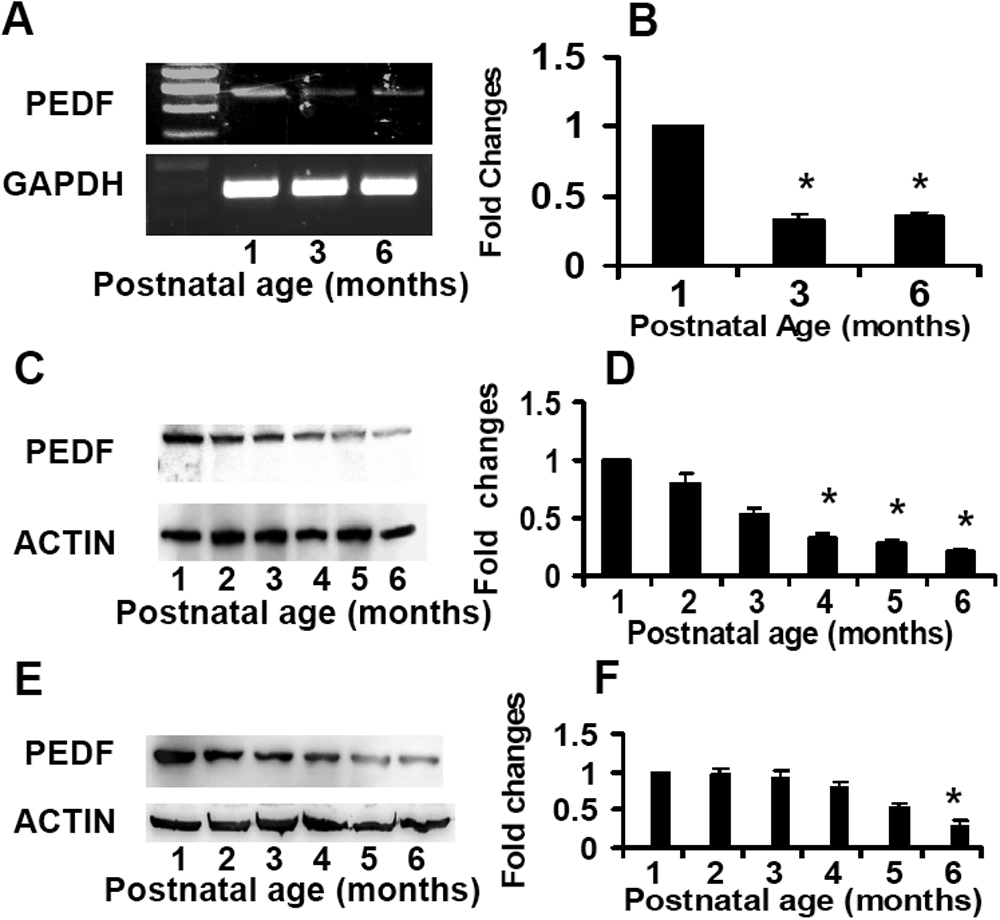
 Figure 2 of
Zhou, Mol Vis 2009; 15:438-450.
Figure 2 of
Zhou, Mol Vis 2009; 15:438-450.