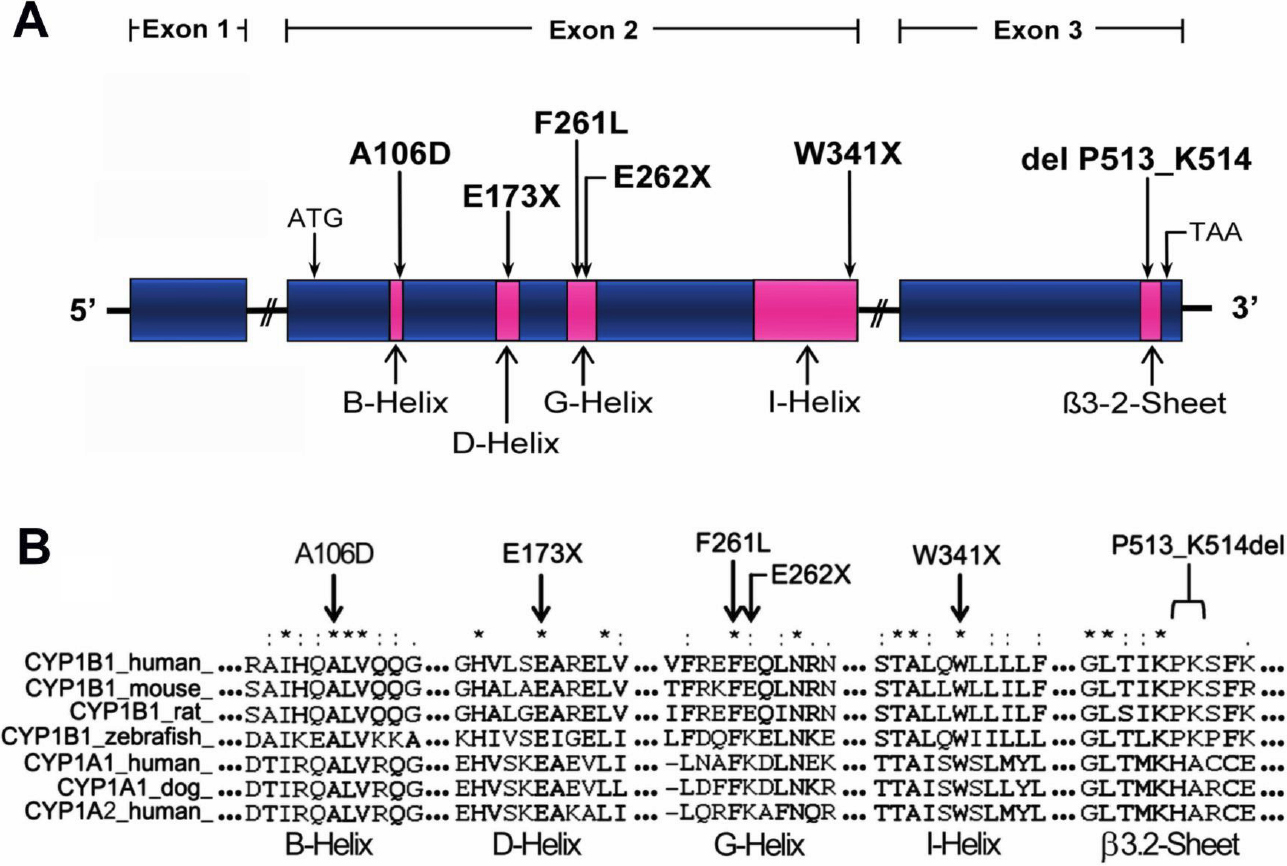
Figure 3. Location of six novel
CYP1B1 mutations found in PCG patients.
A: Scheme of the
CYP1B1 gene showing the position of the novel mutations identified in this study. The three exons are represented by boxes, and different
conserved structural domains encoded by them are depicted in pink.
B: Multiple amino acid sequence alignment of CYP1B1, CYP1A1 and CYP1A2 from different species. The three exons are represented
by boxes, and different conserved structural domains encoded by them are depicted by different patterns and shadings. Sequence
alignment was generated by
ClustalW. Arrows indicate the residues affected by mutations. Different structural domains of the cytochrome P450 superfamily are
indicated. Asterisks indicate amino acid positions at which all query sequences are identical. Amino acid positions at which
all the analyzed sequences had amino acids that were chemically similar are denoted by two dots (:). One dot denotes amino
acid positions with weak chemical similarity (.).
 Figure 3 of
Campos-Mollo, Mol Vis 2009; 15:417-431.
Figure 3 of
Campos-Mollo, Mol Vis 2009; 15:417-431.