Figure 2. Atm mRNA in adult mouse cerebellum and retina, with associated densitometric analysis of the PCR bands. Semiquantitative RT–PCR
was used to determine the relative amounts of Atm and cyclophilin A mRNAs in C57BL/6J mouse cerebellum (CE), neuroretina (R), retinal pigment epithelium (RPE), ciliary body (CB), and lens (L)
at P60. A: The 472-bp and the 311-bp bands correspond to Atm and cyclophilin A PCR products, respectively. The cyclophilin A cDNA band obtained by RT–PCR was used as an internal control. B: Results represent the ATM cDNA relative levels calculated as the ratios of the intensities of the Atm and cyclophilin A bands (n=3). Values are expressed as mean±SEM, and ANOVA was performed to determine the difference between tissues. Asterisk
(*) indicates p<0.001.
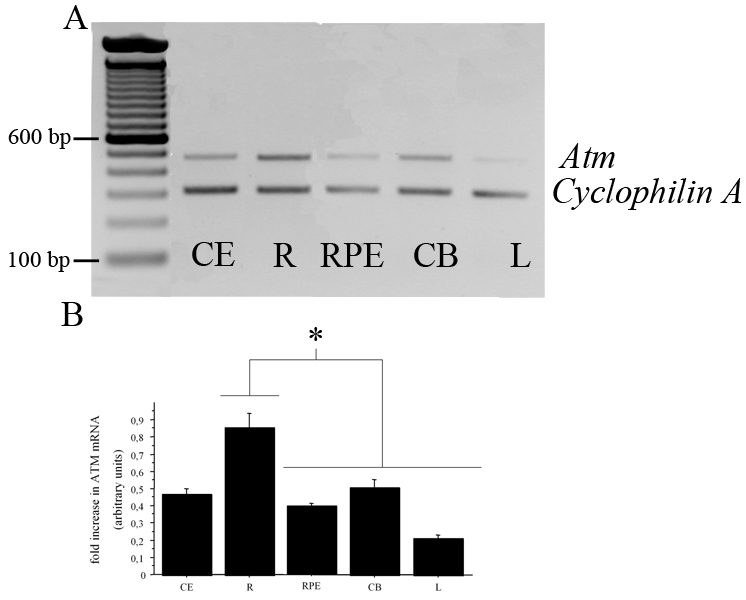
 Figure 2 of
Leemput, Mol Vis 2009; 15:393-416.
Figure 2 of
Leemput, Mol Vis 2009; 15:393-416.