Figure 4. Polar plot map showing the preferred orientation of fibrils in a centrally located 14 mm excised button from an uninjured
control bovine cornea. Fibrils tend to have a circular arrangement in the periphery of the tissue and vertical preferred orientation
in central areas (A). The scale at the bottom is in millimeters. Plots have been scaled down by the factors shown in the color key. The contour
map shows the distribution of total fibrillar collagen X-ray scattering in arbitrary units (B).
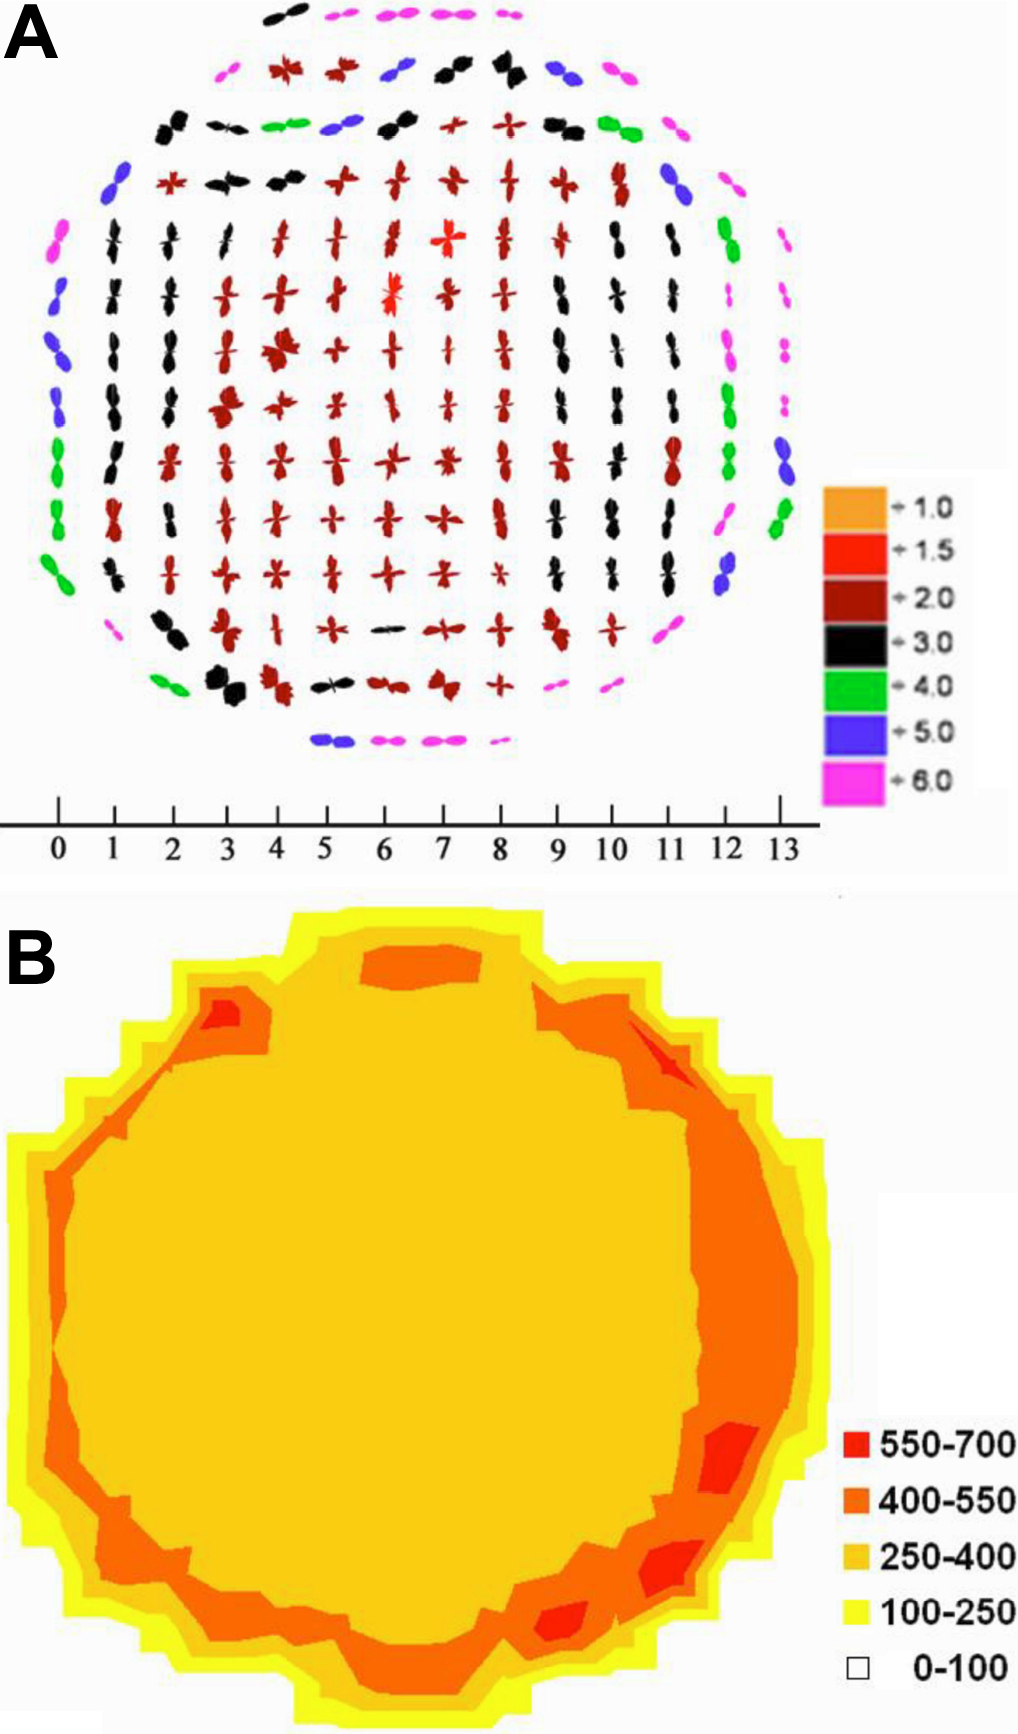
 Figure 4 of
Kamma-Lorger, Mol Vis 2009; 15:378-385.
Figure 4 of
Kamma-Lorger, Mol Vis 2009; 15:378-385.