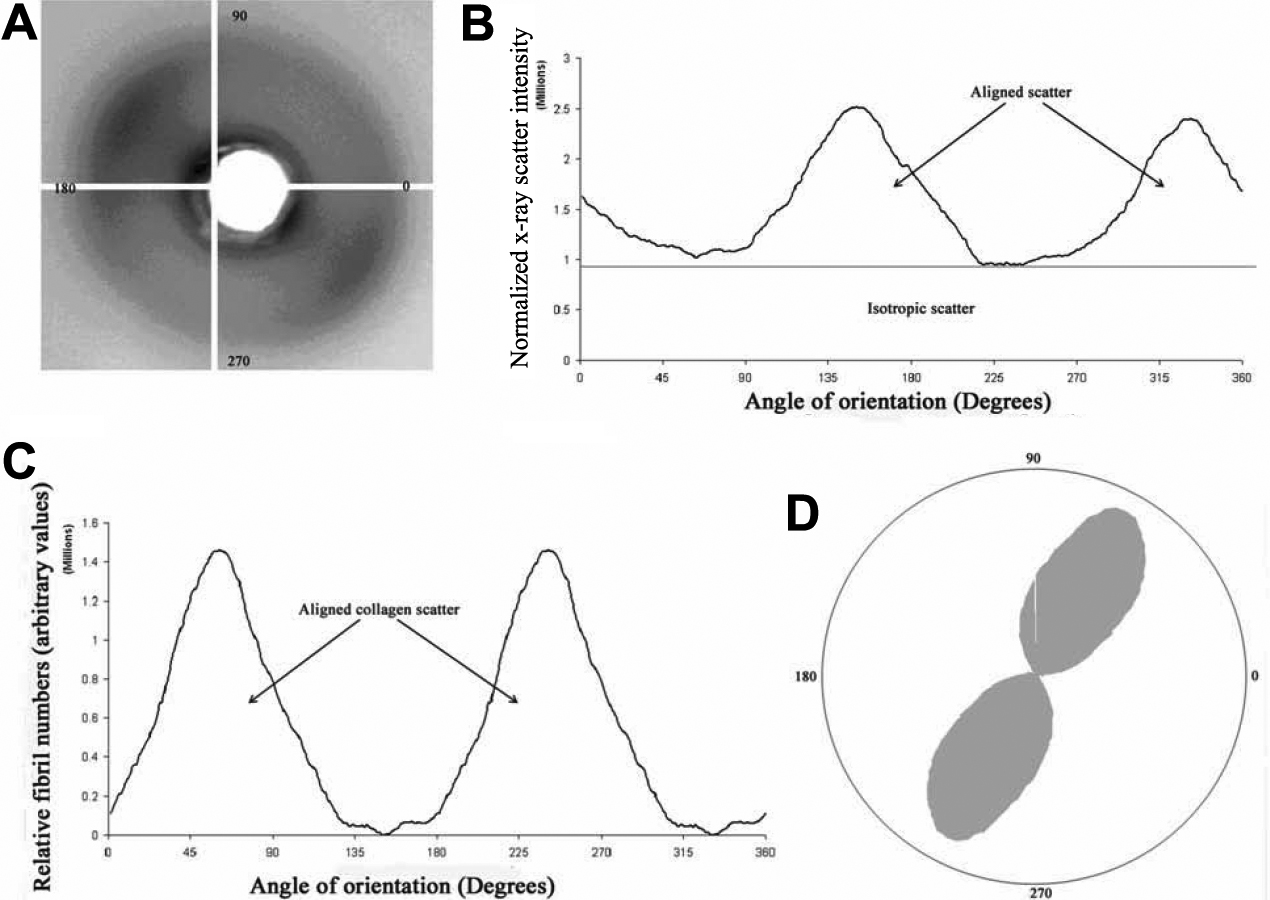
Figure 2. Diagram depicting the main stages of the wide angle X-ray diffraction analysis. An X-ray diffraction pattern (
A) was obtained by passing the X-ray beam through the cornea parallel to the optical axis. The pattern was integrated radially
across the width of the equatorial reflection and an intensity profile for each rotation angle between 0° and 360° was produced
(
B). The plot of integrated intensity as a function of rotation angle may be separated into two components, scatter from isotropically
arranged collagen and scatter from preferentially aligned collagen [
13] (Black horizontal line,
B). After removal of the isotropic component, data were shifted by 90° to account for the fact that equatorial reflections
occur at right angles to the collagen fibril axis [
11]. The data (
C) then represent the distribution of aligned collagen as a function of rotation angle, and this distribution may be expressed
in polar coordinates [
2] (
D). The size of the polar plot in any given direction represents the amount of collagen preferentially oriented in that direction.
 Figure 2 of
Kamma-Lorger, Mol Vis 2009; 15:378-385.
Figure 2 of
Kamma-Lorger, Mol Vis 2009; 15:378-385.