Figure 3. Fold difference of S100A4,
S100A6, S100A8, S100A9, and S100A11 gene
transcripts in pterygium tissue relative to conjunctiva tissue. Total
RNA was extracted from uninvolved conjunctiva and pterygium tissue
after mechanical homogenization. Reverse transcription for 0.5 μg of
total RNA. Glyceraldehyde-3-phosphate dehydrogenase (GAPDH) was
used as the internal control. ΔCt was calculated by
subtracting the Ct of GAPDH from the Ct
of the targeted gene. The fold change was determined by the ΔΔCt
method (see text). The uninvolved conjunctiva sample was used as a
reference for each of the tested S100 transcripts in the pterygium
sample. Height of the bars represents mean value and error bars
represent standard deviation. An asterisk indicates that p is less than
0.05 (p<0.05).
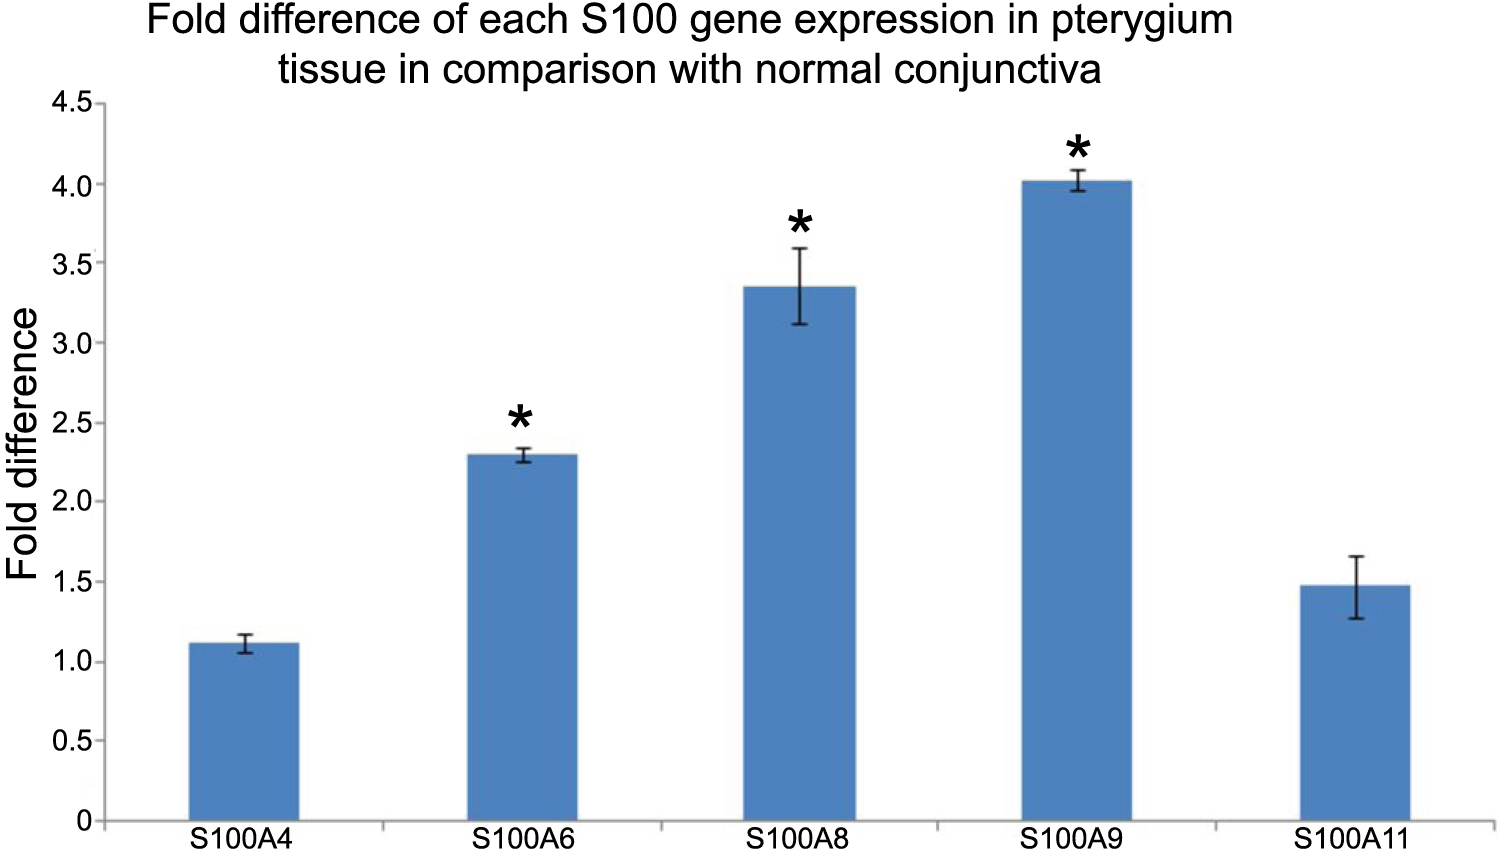
 Figure 3 of Riau, Mol Vis 2009; 15:335-342.