Figure 4. Effect of TGF-β1 and MAPKs on
the stretch-induced expression of IL-6.Three independent
primary cultures of HTM cells were serum-starved for 16 h, pre-treated
for 2 h with the MAPK inhibitors (10 μM) or with the TGFRI inhibitor,
and then subjected for 16 h to cyclic mechanical stress (5% elongation,
one cycle per second) in the presence of the inhibitors (5 μM). A:
Secreted IL-6 quantified by ELISA after 16 h of mechanical stress is
shown in the chart. B: Differential IL-6 mRNA
expression compared to control-DMSO, calculated at 16 h of mechanical
stress. The asterisk indicates that p is less than 0.05, and the double
asterisk denotes that p is less than 0.005. Statistical significance
between groups was assessed by the paired Student's t-test
(n=3).
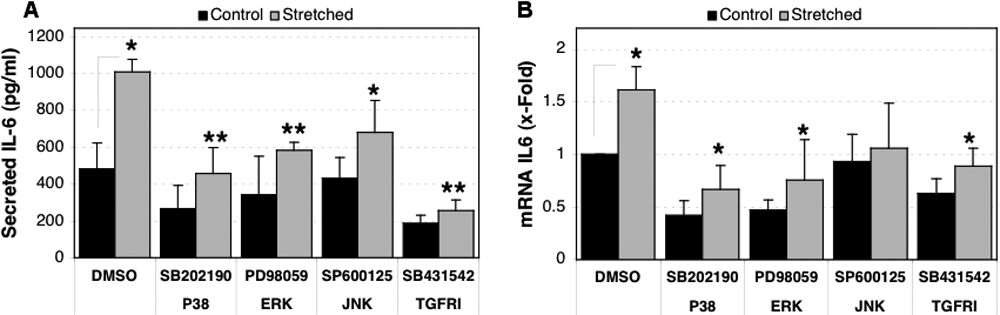
 Figure 4 of Liton, Mol Vis 2009; 15:326-334.