Figure 3. Effect of MAPK on the TGF-β1
induced expression of IL-6. Three independent primary cultures
of HTM cells were serum-starved for 16 h, pre-treated for 2 h with the
MAPK inhibitors, and then incubated in serum-free media with TGF-β1 (5
ng/ml) in the presence of the MAPK inhibitors (10 μM). A:
Secreted IL-6 quantified by ELISA at 16 h post-treatment is shown. B:
Differential IL-6 mRNA expression compared to control-DMSO,
calculated at 6 h post-treatment. The asterisk indicates that p is
greater than 0.001, and a double asterisk denotes that p is less than
0.001. Statistical significance between groups was assessed by the
paired Student's t-test (n=3).
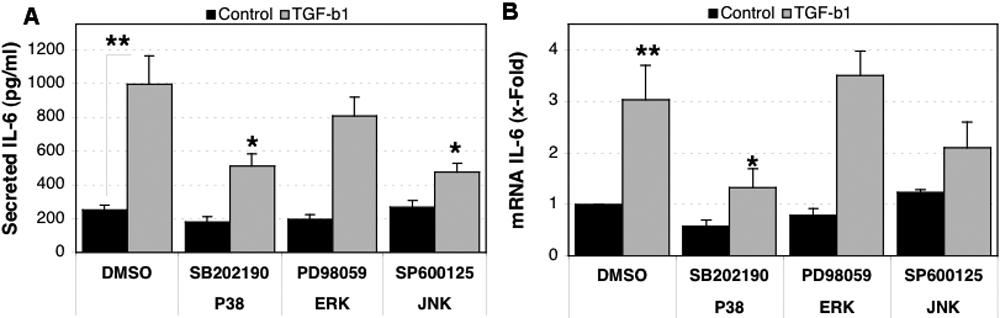
 Figure 3 of Liton, Mol Vis 2009; 15:326-334.