Figure 1. β-Actin mRNA expression. (A)
β-Actin mRNA expression, expressed as a function of the Ct
value, in HTM cells exposed to TGF-β1 (5 ng/ml) treatment during the
indicated times. (B) β-Actin mRNA expression in HTM
cells subjected to cyclic mechanical stress and MAPK inhibitors.
Statistical significance between groups was assessed by the paired
Student's t-test (n=3).
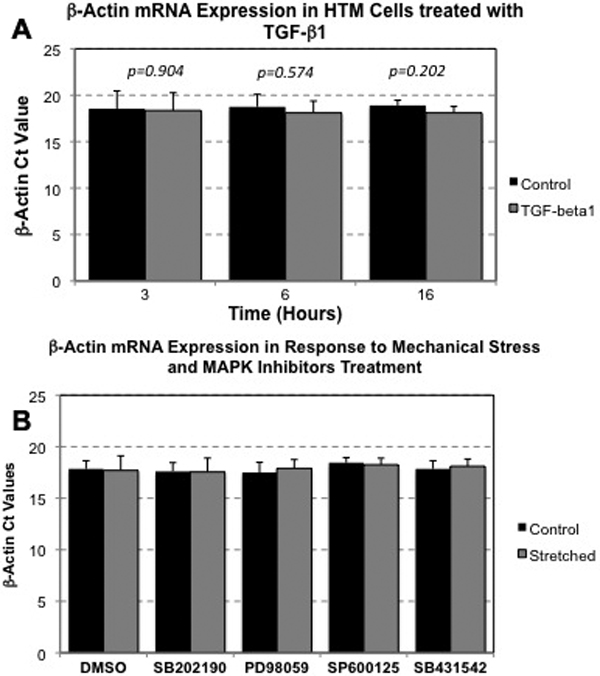
 Figure 1 of Liton, Mol Vis 2009; 15:326-334.