Figure 4. Spectral domain high-definition
optical coherence tomography and electro-oculogram findings of patient
FG10, patient FG05 and patient FG04. Spectral domain high-definition
optical coherence tomography scan of the right eye of patient FG10 (A,
upper panel) shows normal macular findings. Electro-oculogram of
the same eye (A, bottom panel) shows the light-peak saccade not
uniform, being the light-peak to dark-trough ratio overall normal
(>1.55). Electro-oculograms of the right eye of patient FG05 (B),
and of the left eye patient FG04 (C), show normal light-peak to
dark-trough ratio (>1.55).
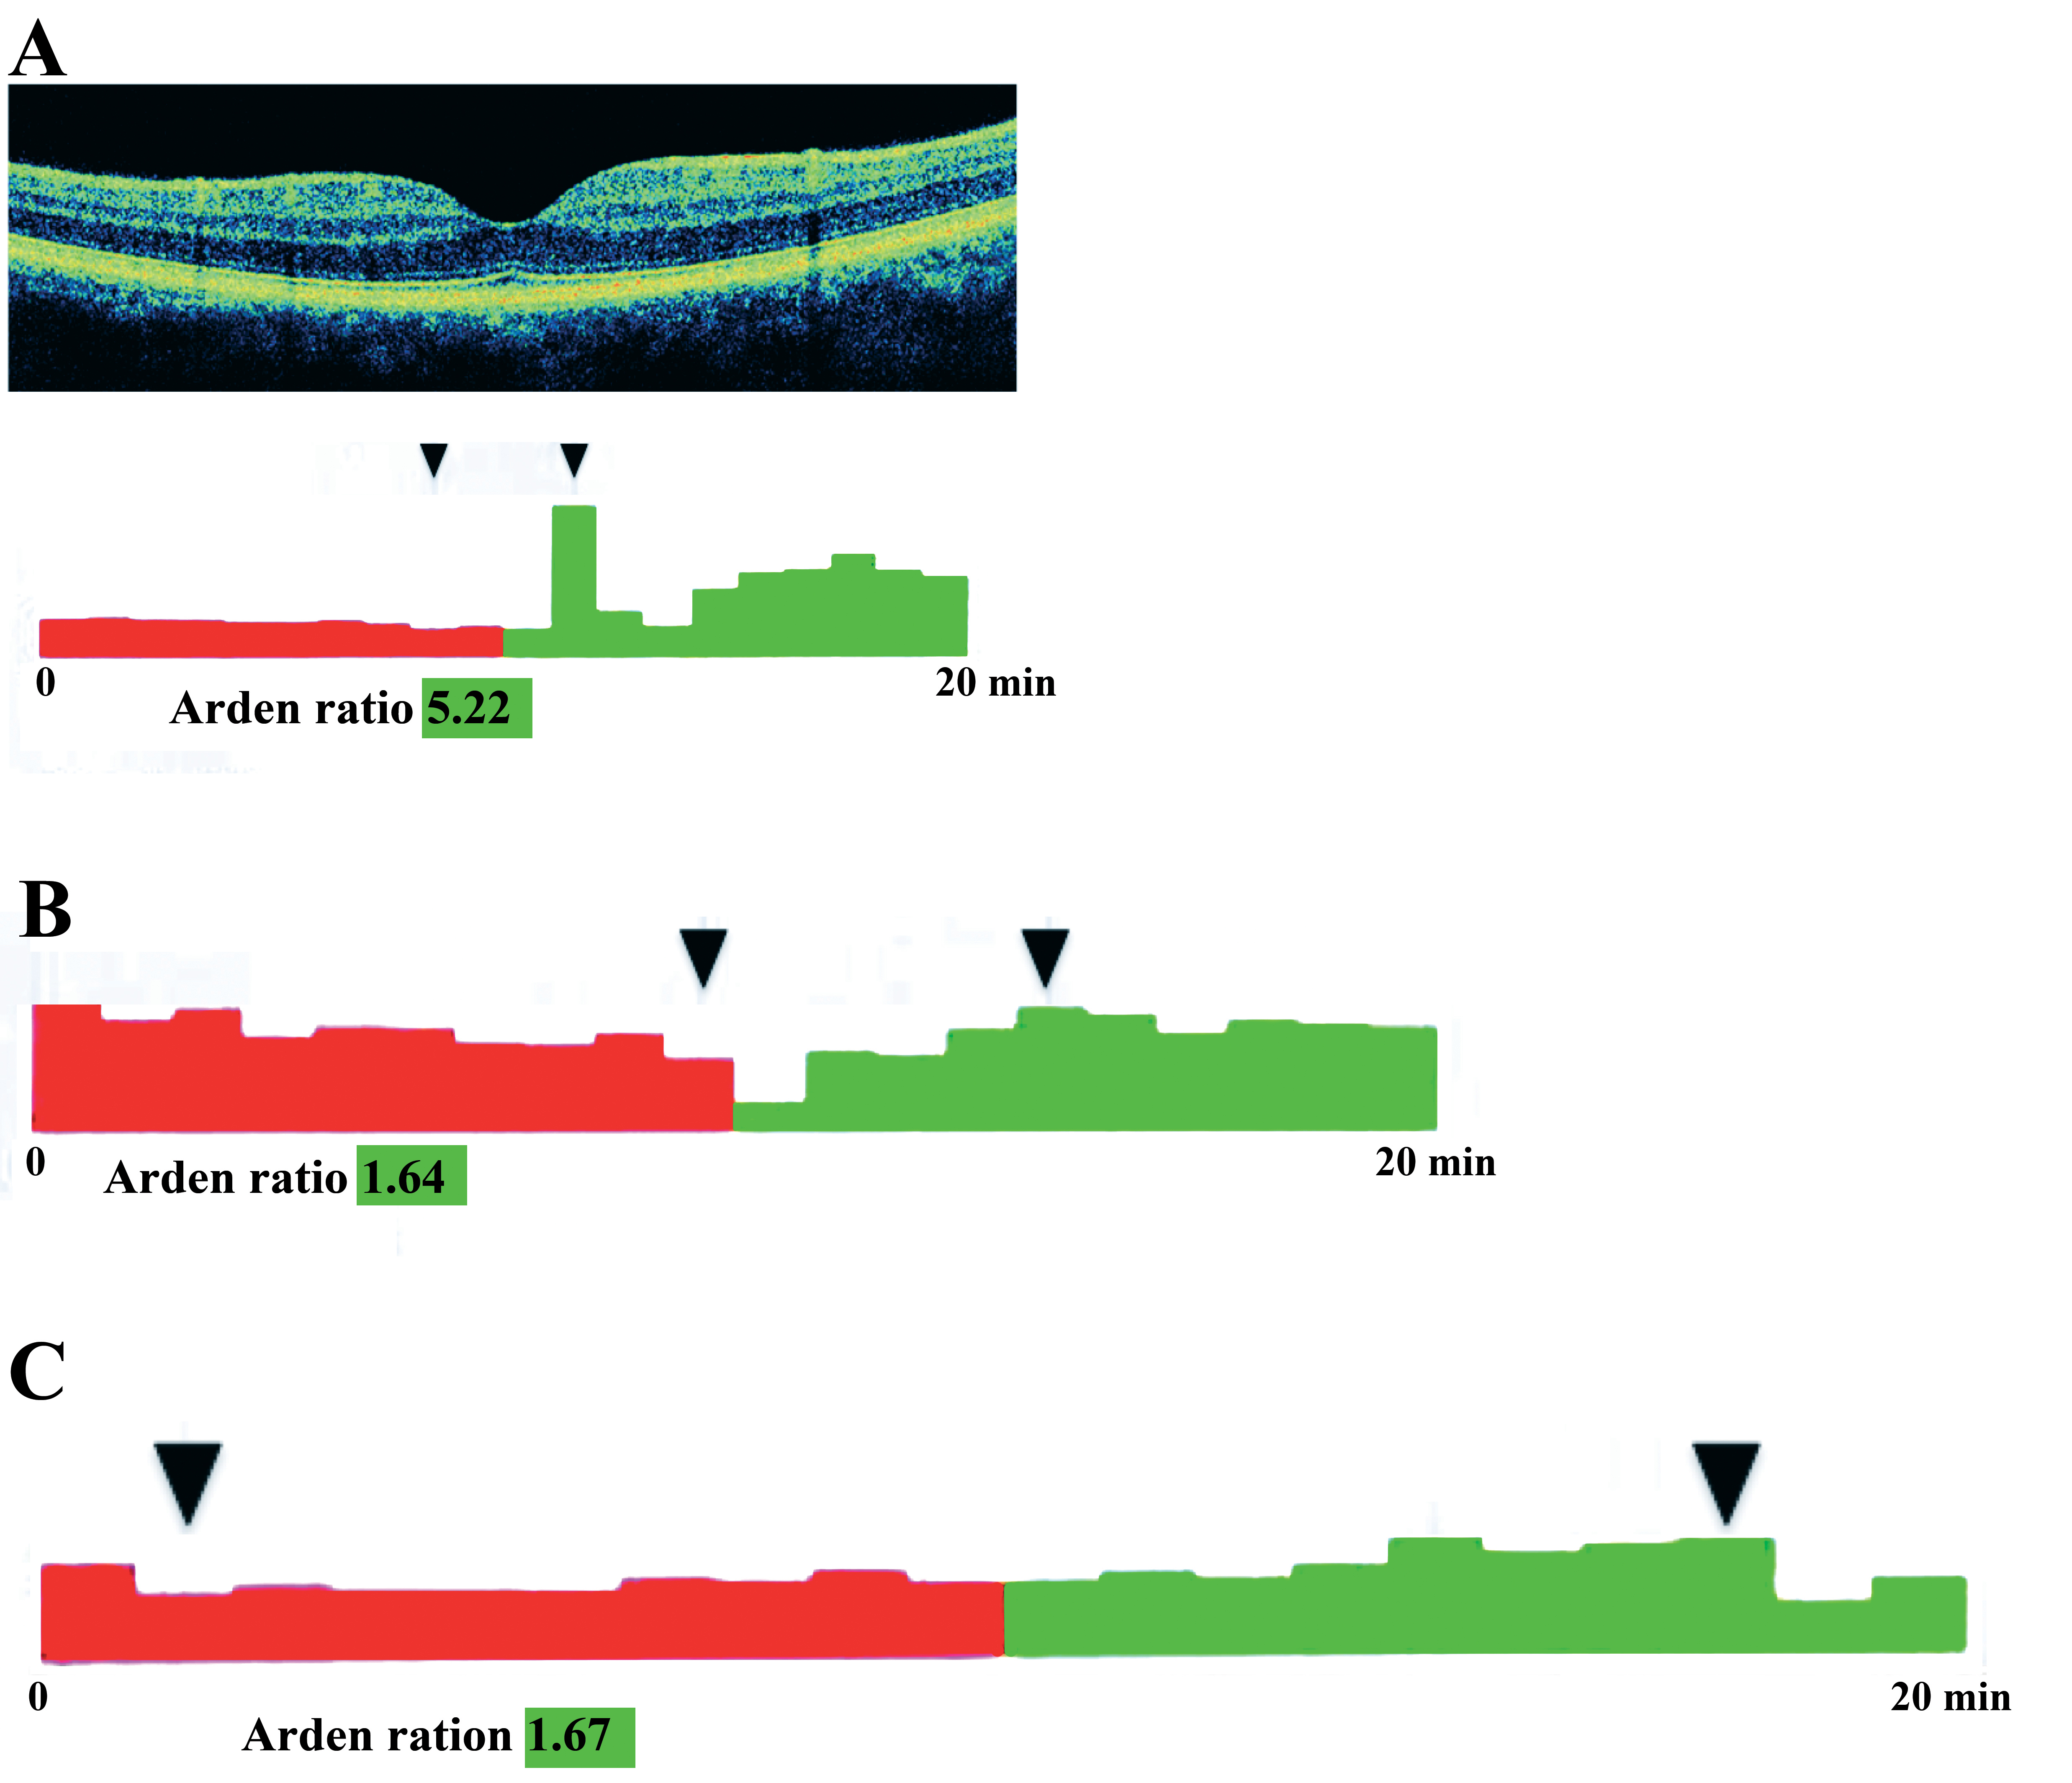
 Figure 4 of Querques, Mol Vis 2009; 15:2960-2972.