Figure 1. Pedigree and haplotype diagram of the family. Filled squares (male) or circles (female) represent individuals affected with
high myopia. Blackened filled bars indicate the chromosomal regions that are derived from the ancestral disease-associated
haplotype.
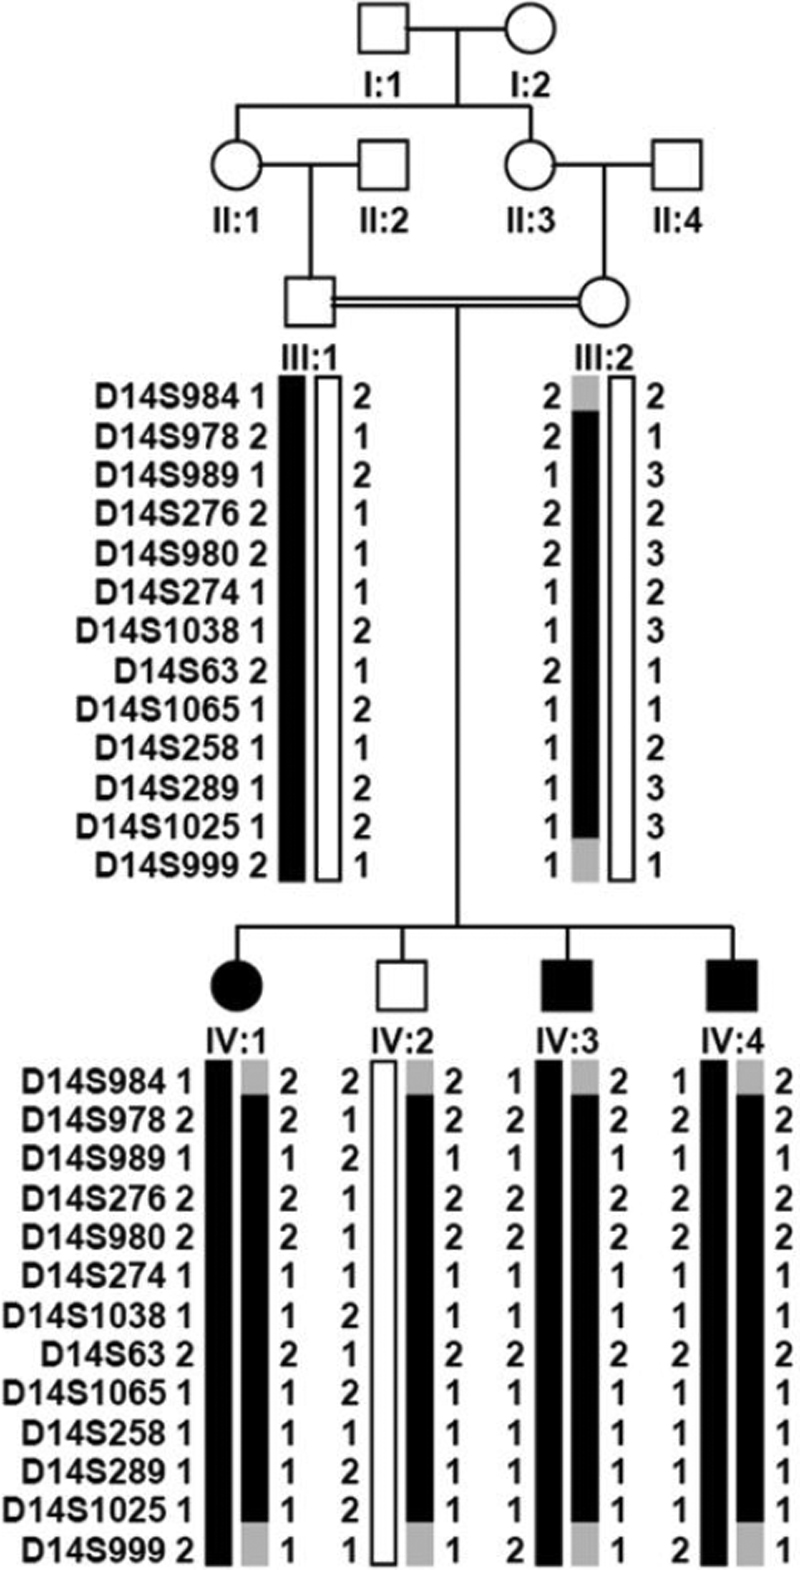
 Figure 1 of
Yang, Mol Vis 2009; 15:312-318.
Figure 1 of
Yang, Mol Vis 2009; 15:312-318.