Figure 1. A: Linkage disequilibrium plot of five SNPs of the TLR2 gene in NTG patients and controls. A schematic of TLR2 is shown as a black line, with boxes representing its three exons. The locations of the selected SNPs are indicated by the
dotted lines. The D’ value corresponding to each SNP pair is expressed as a percentage and shown within the respective square.
Higher D’ values are indicated in brighter red. B: Haplotype structure and diversity of TLR2. Common haplotypes of the two blocks are listed. Haplotype frequencies observed in NTG patients and controls are given in
parentheses. The line thickness reflects the frequency of adjacent block haplotype distribution (thick lines, >10%; thin lines,
1%–10%).
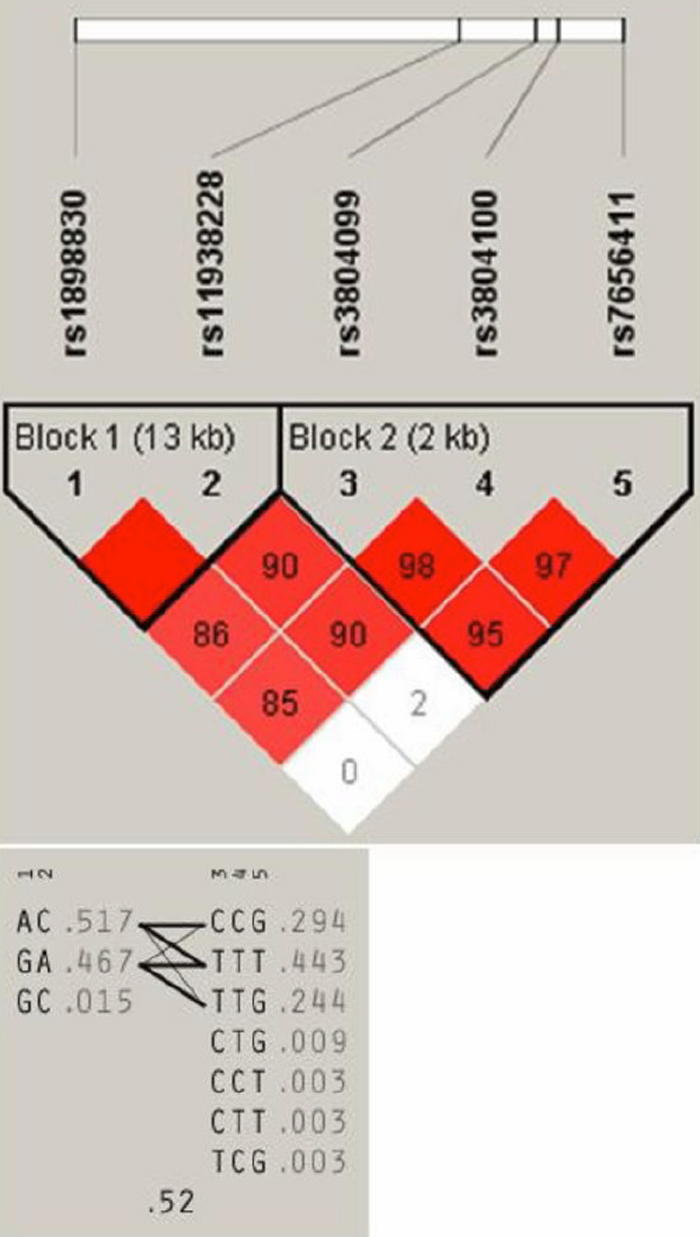
 Figure 1 of
Nakamura, Mol Vis 2009; 15:2905-2910.
Figure 1 of
Nakamura, Mol Vis 2009; 15:2905-2910.