Figure 4. NMDA receptor subunit mRNA
expression in the rat retina following hypoxia and 24-h recovery in
air. For each mRNA, transcript abundance, normalized to acidic
ribosomal protein P0, was measured by qRT–PCR. Values were then further
normalized to the control level of each transcript. Data represent mean
(±SD) of 5 independent experiments. NMDAR1 mRNA levels were higher in
hypoxic samples compared to control and in recovery samples compared to
control. NMDAR2C mRNA levels were higher in hypoxia samples compared to
the control samples. NMDAR2D mRNA levels were higher in hypoxia samples
compared to the control samples. The asterisks indicate significance
levels assessed via ANOVA followed by post-hoc tests: * - p<0.05; **
- p<0.01; *** - p<0.001.
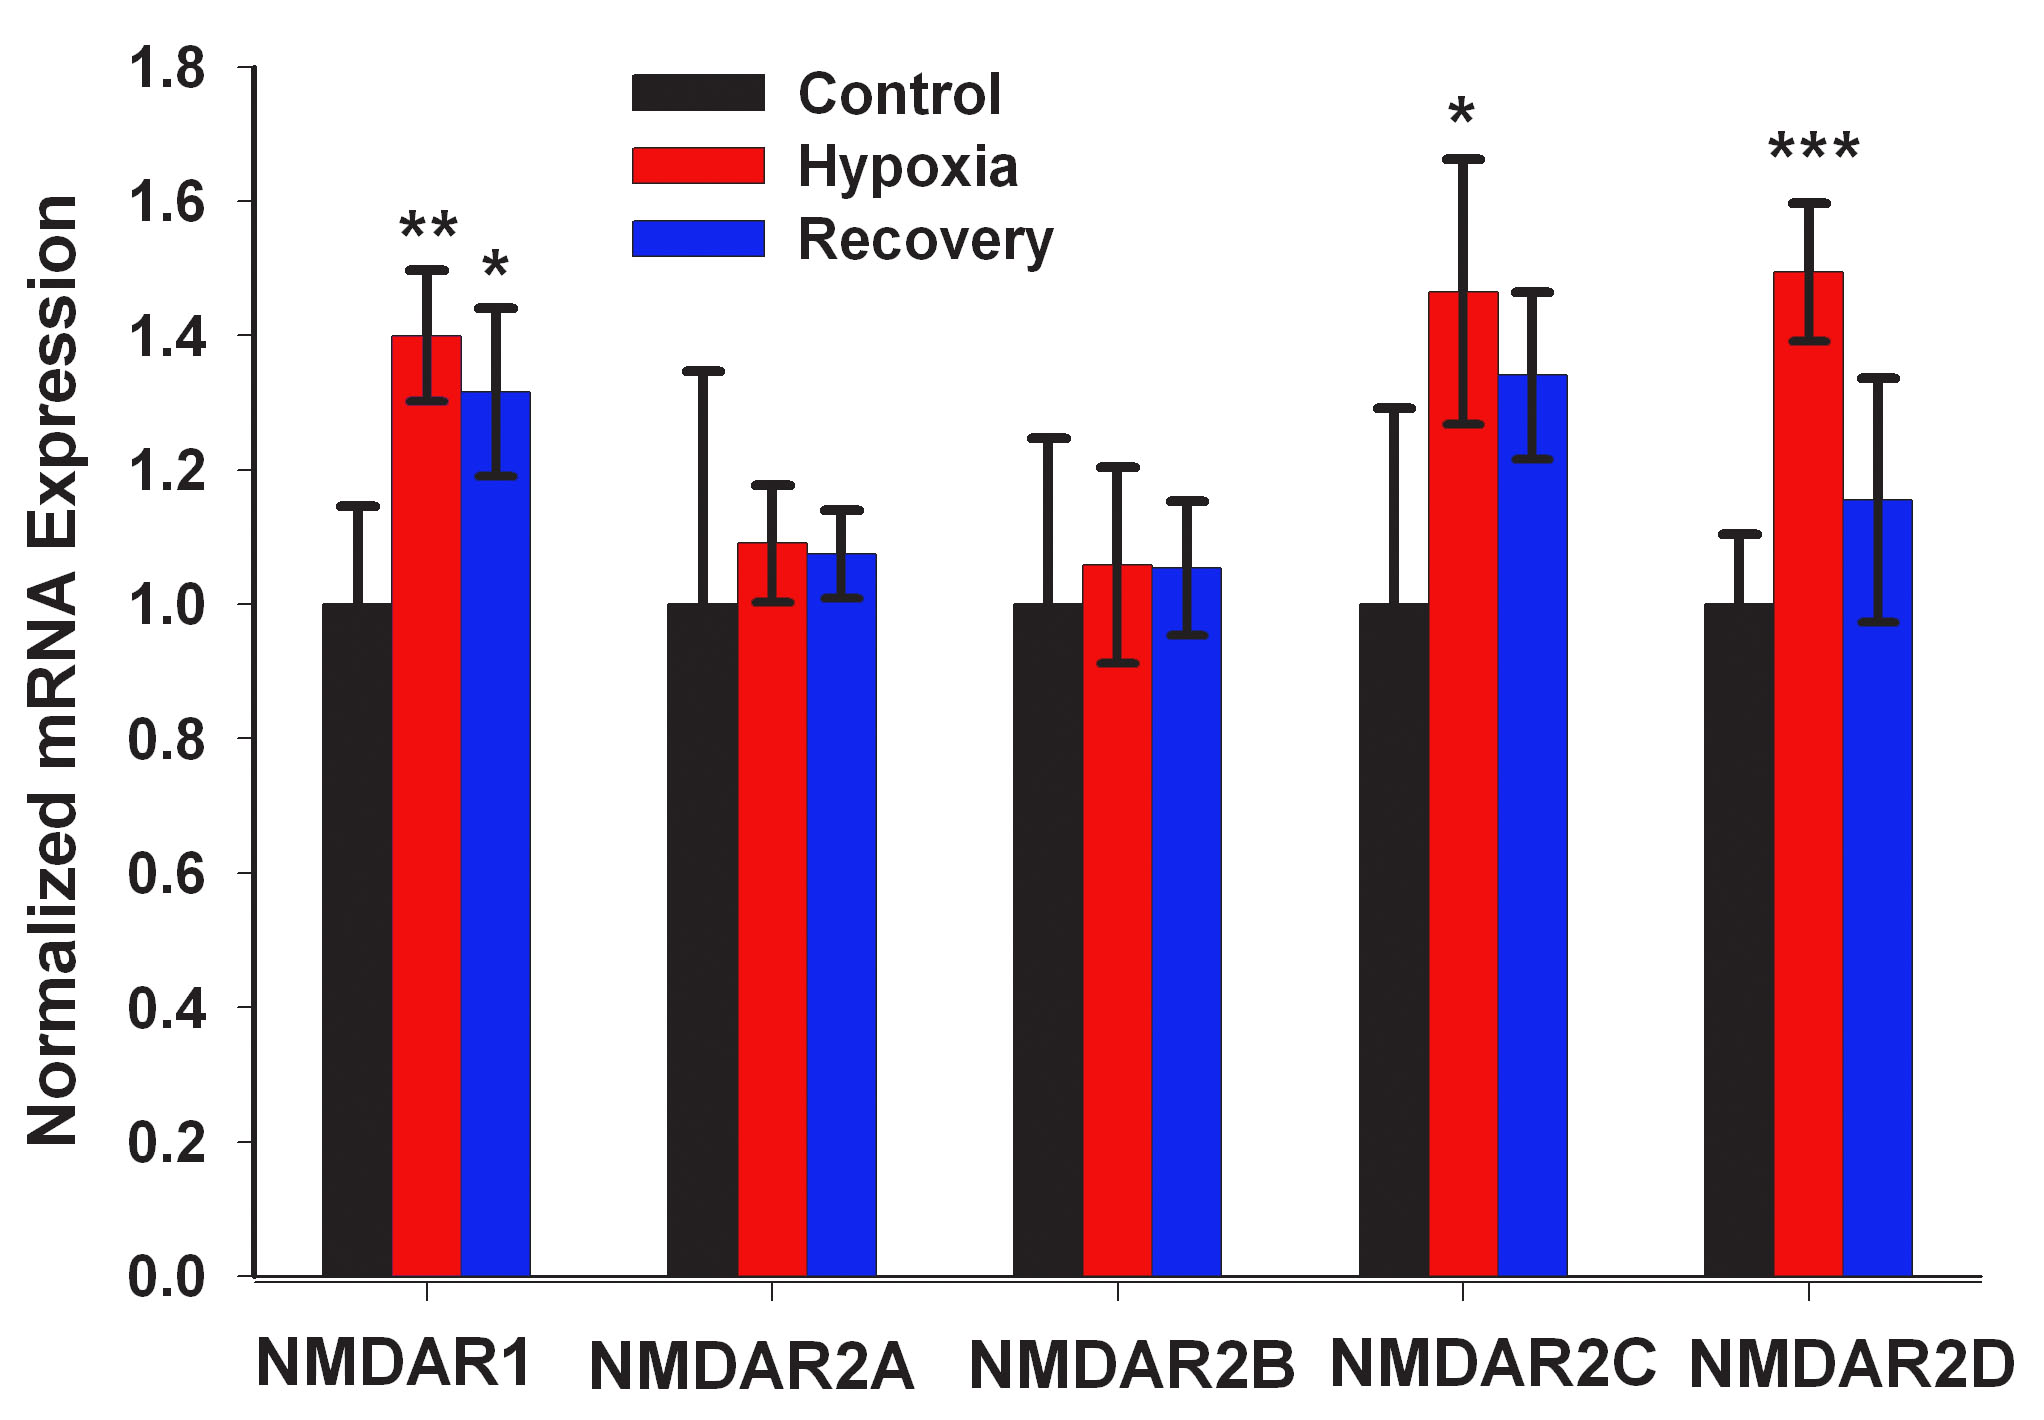
 Figure 4 of Crosson, Mol Vis 2009; 15:296-311.