Figure 3. Summary of microarray data.
Shown is an examination of the microarray databased on the number of
genes upregulated, downregulated, or not changed. These gene changes
were categorized into major functional groups. Upward arrows indicate
numbers of genes that were significantly upregulated; down arrows
indicate those that were downregulated; and horizontal bars represent
those that were not altered. The recovery column shows how the genes in
each category were affected during recovery. Ellipses indicate that
these were not the only categories affected.
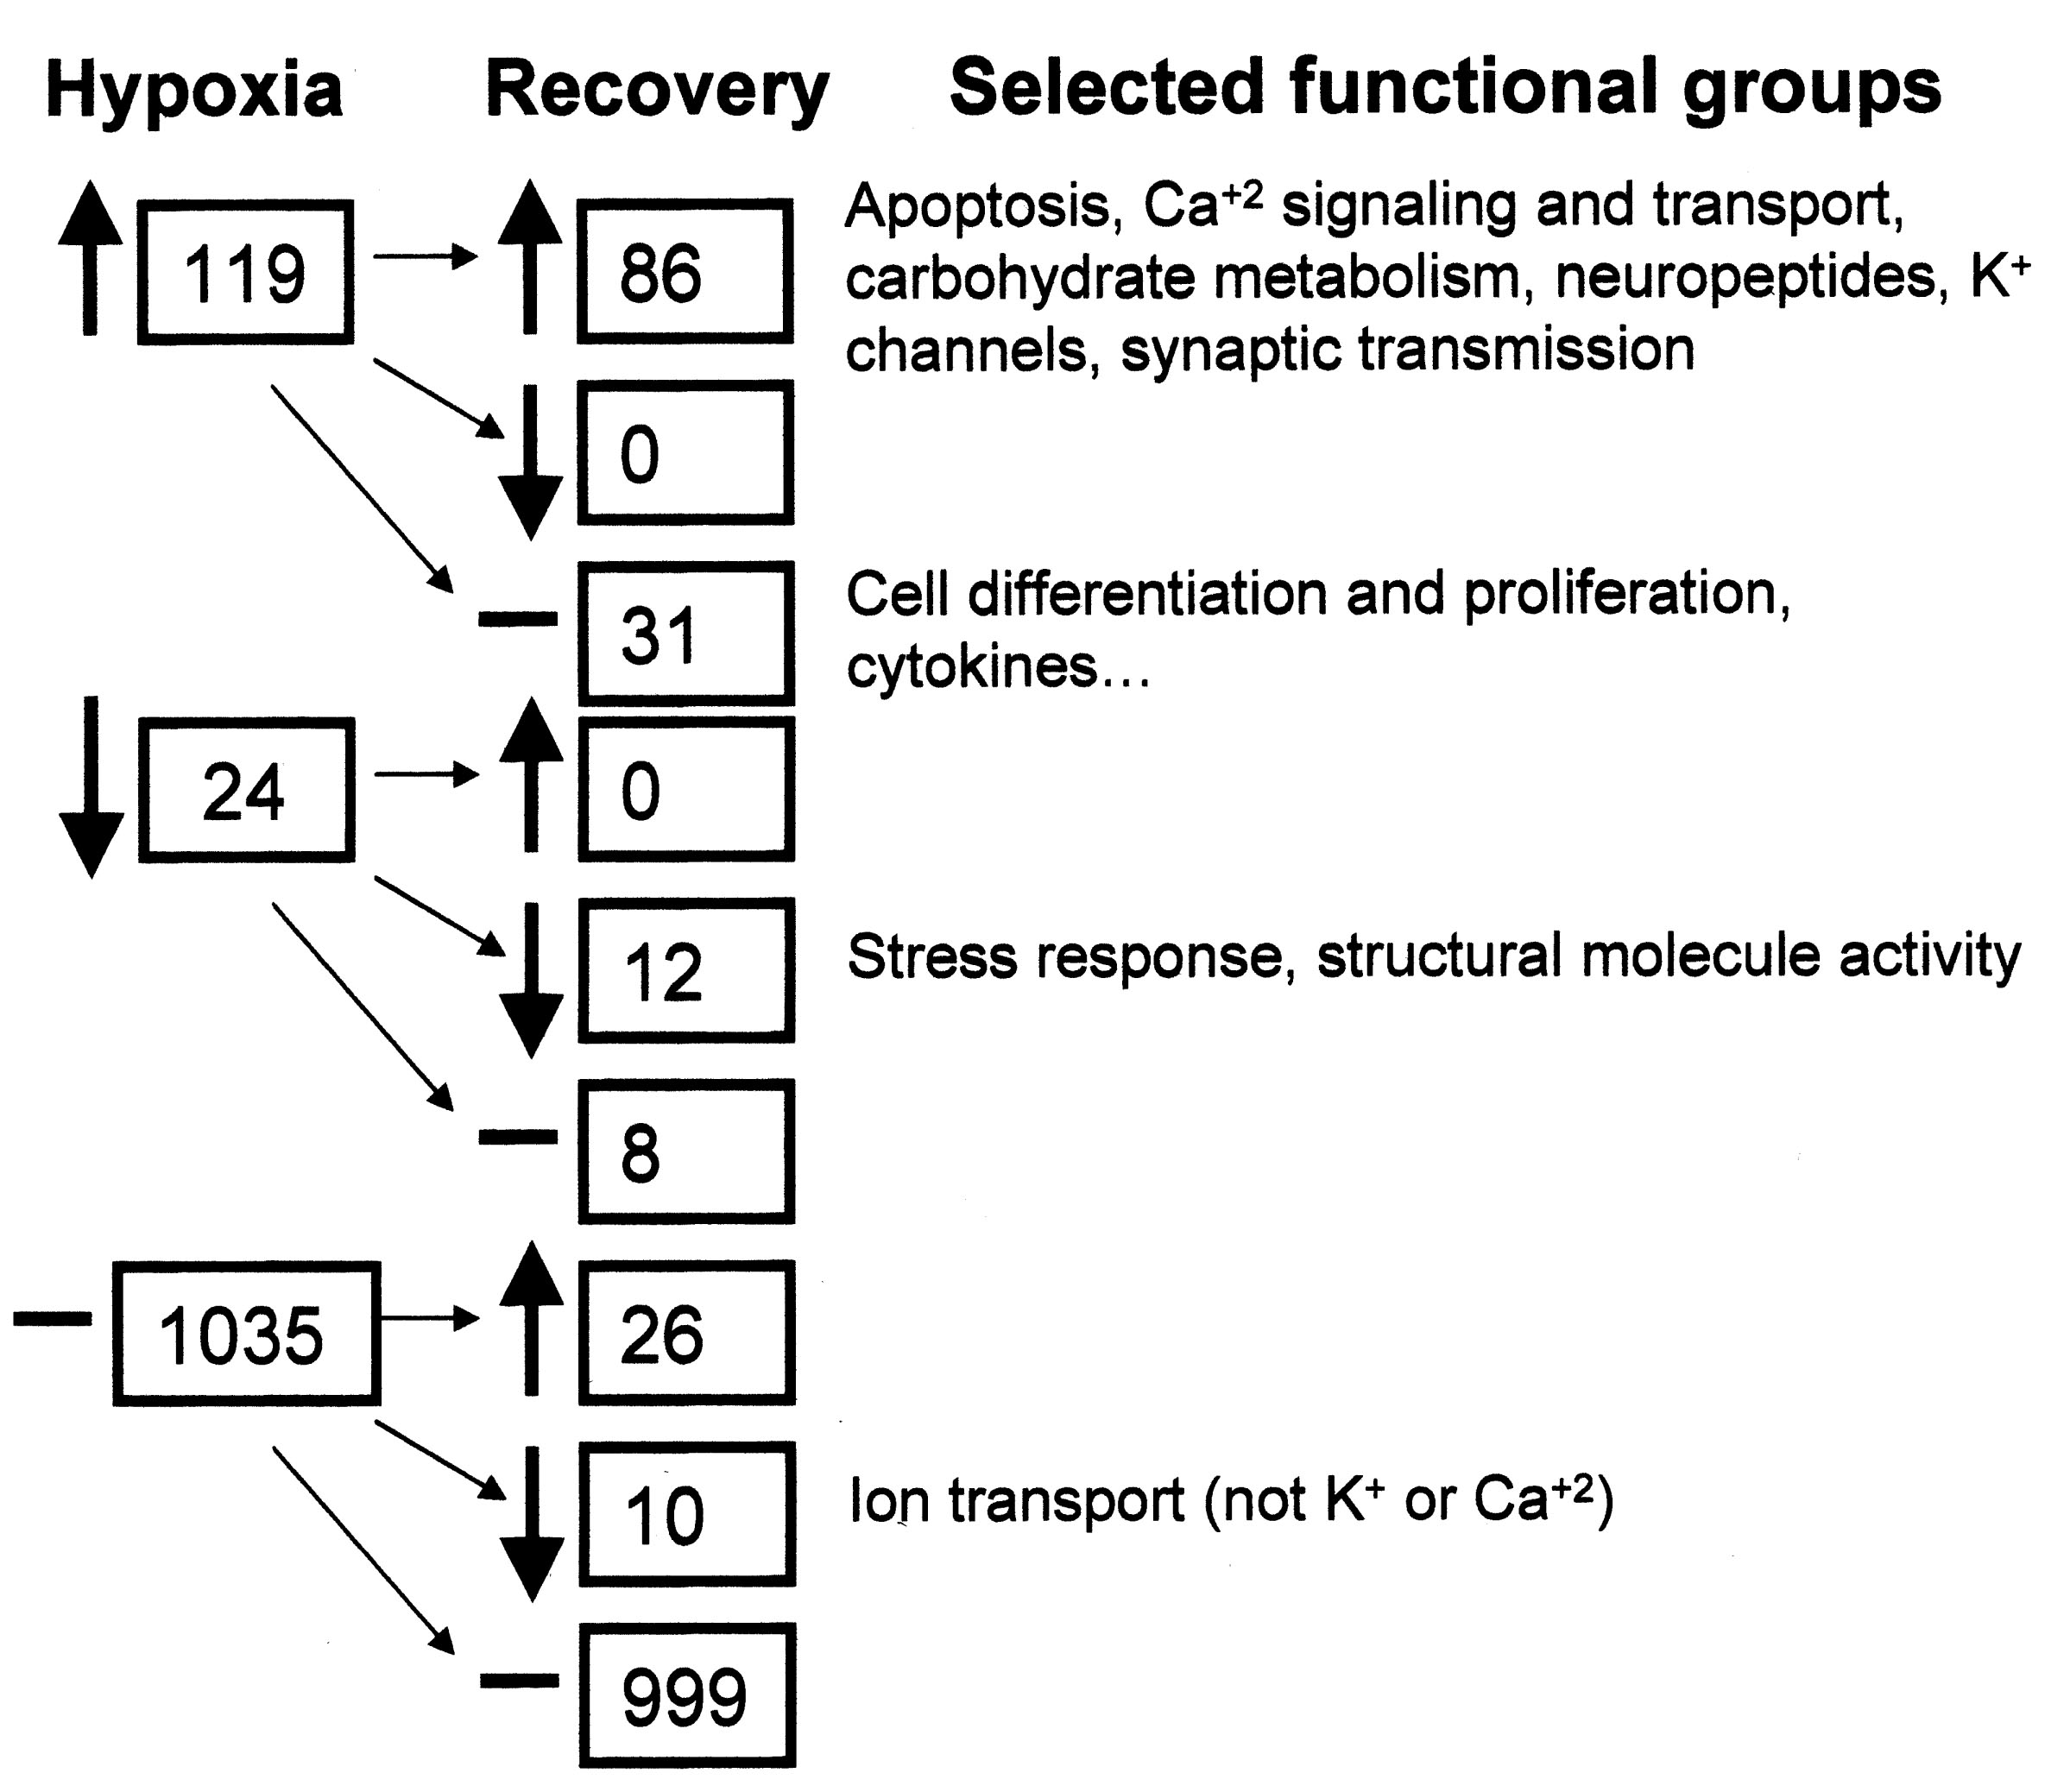
 Figure 3 of Crosson, Mol Vis 2009; 15:296-311.