Figure 2. qRT–PCR analysis of known
hypoxia-associated mRNAs. For each mRNA, transcript abundance,
normalized to acidic ribosomal protein P0, was calculated by qRT–PCR.
Values were then further normalized to the control level of each
transcript. Data represent mean (±SD) of 5 independent experiments. A:
The expression of VEGF and VEGF receptors Flk-1 and Flt-1
mRNA was measured in the rat retina immediately following 3 h of
hypoxia and after 24 h of recovery in air. VEGF and Flk-1 were
significantly higher in hypoxic samples as compared to control. Flt-1
tended to increase during hypoxia, but the difference from control was
not significant. B: The expression of erythropoietin (EPO)
and erythropoietin receptor (EPOR) mRNA was measured in the rat
retina immediately following 3 h of hypoxia and after 24 h of recovery
in air. EPO mRNA levels were significantly higher in hypoxic samples as
compared to control. A significant difference was also observed for the
EPOR control and hypoxia mRNA levels between hypoxic and recovery
samples. The asterisks indicate significance levels assessed via ANOVA
followed by post-hoc tests: * - p<0.05; ** - p<0.01; *** -
p<0.001.
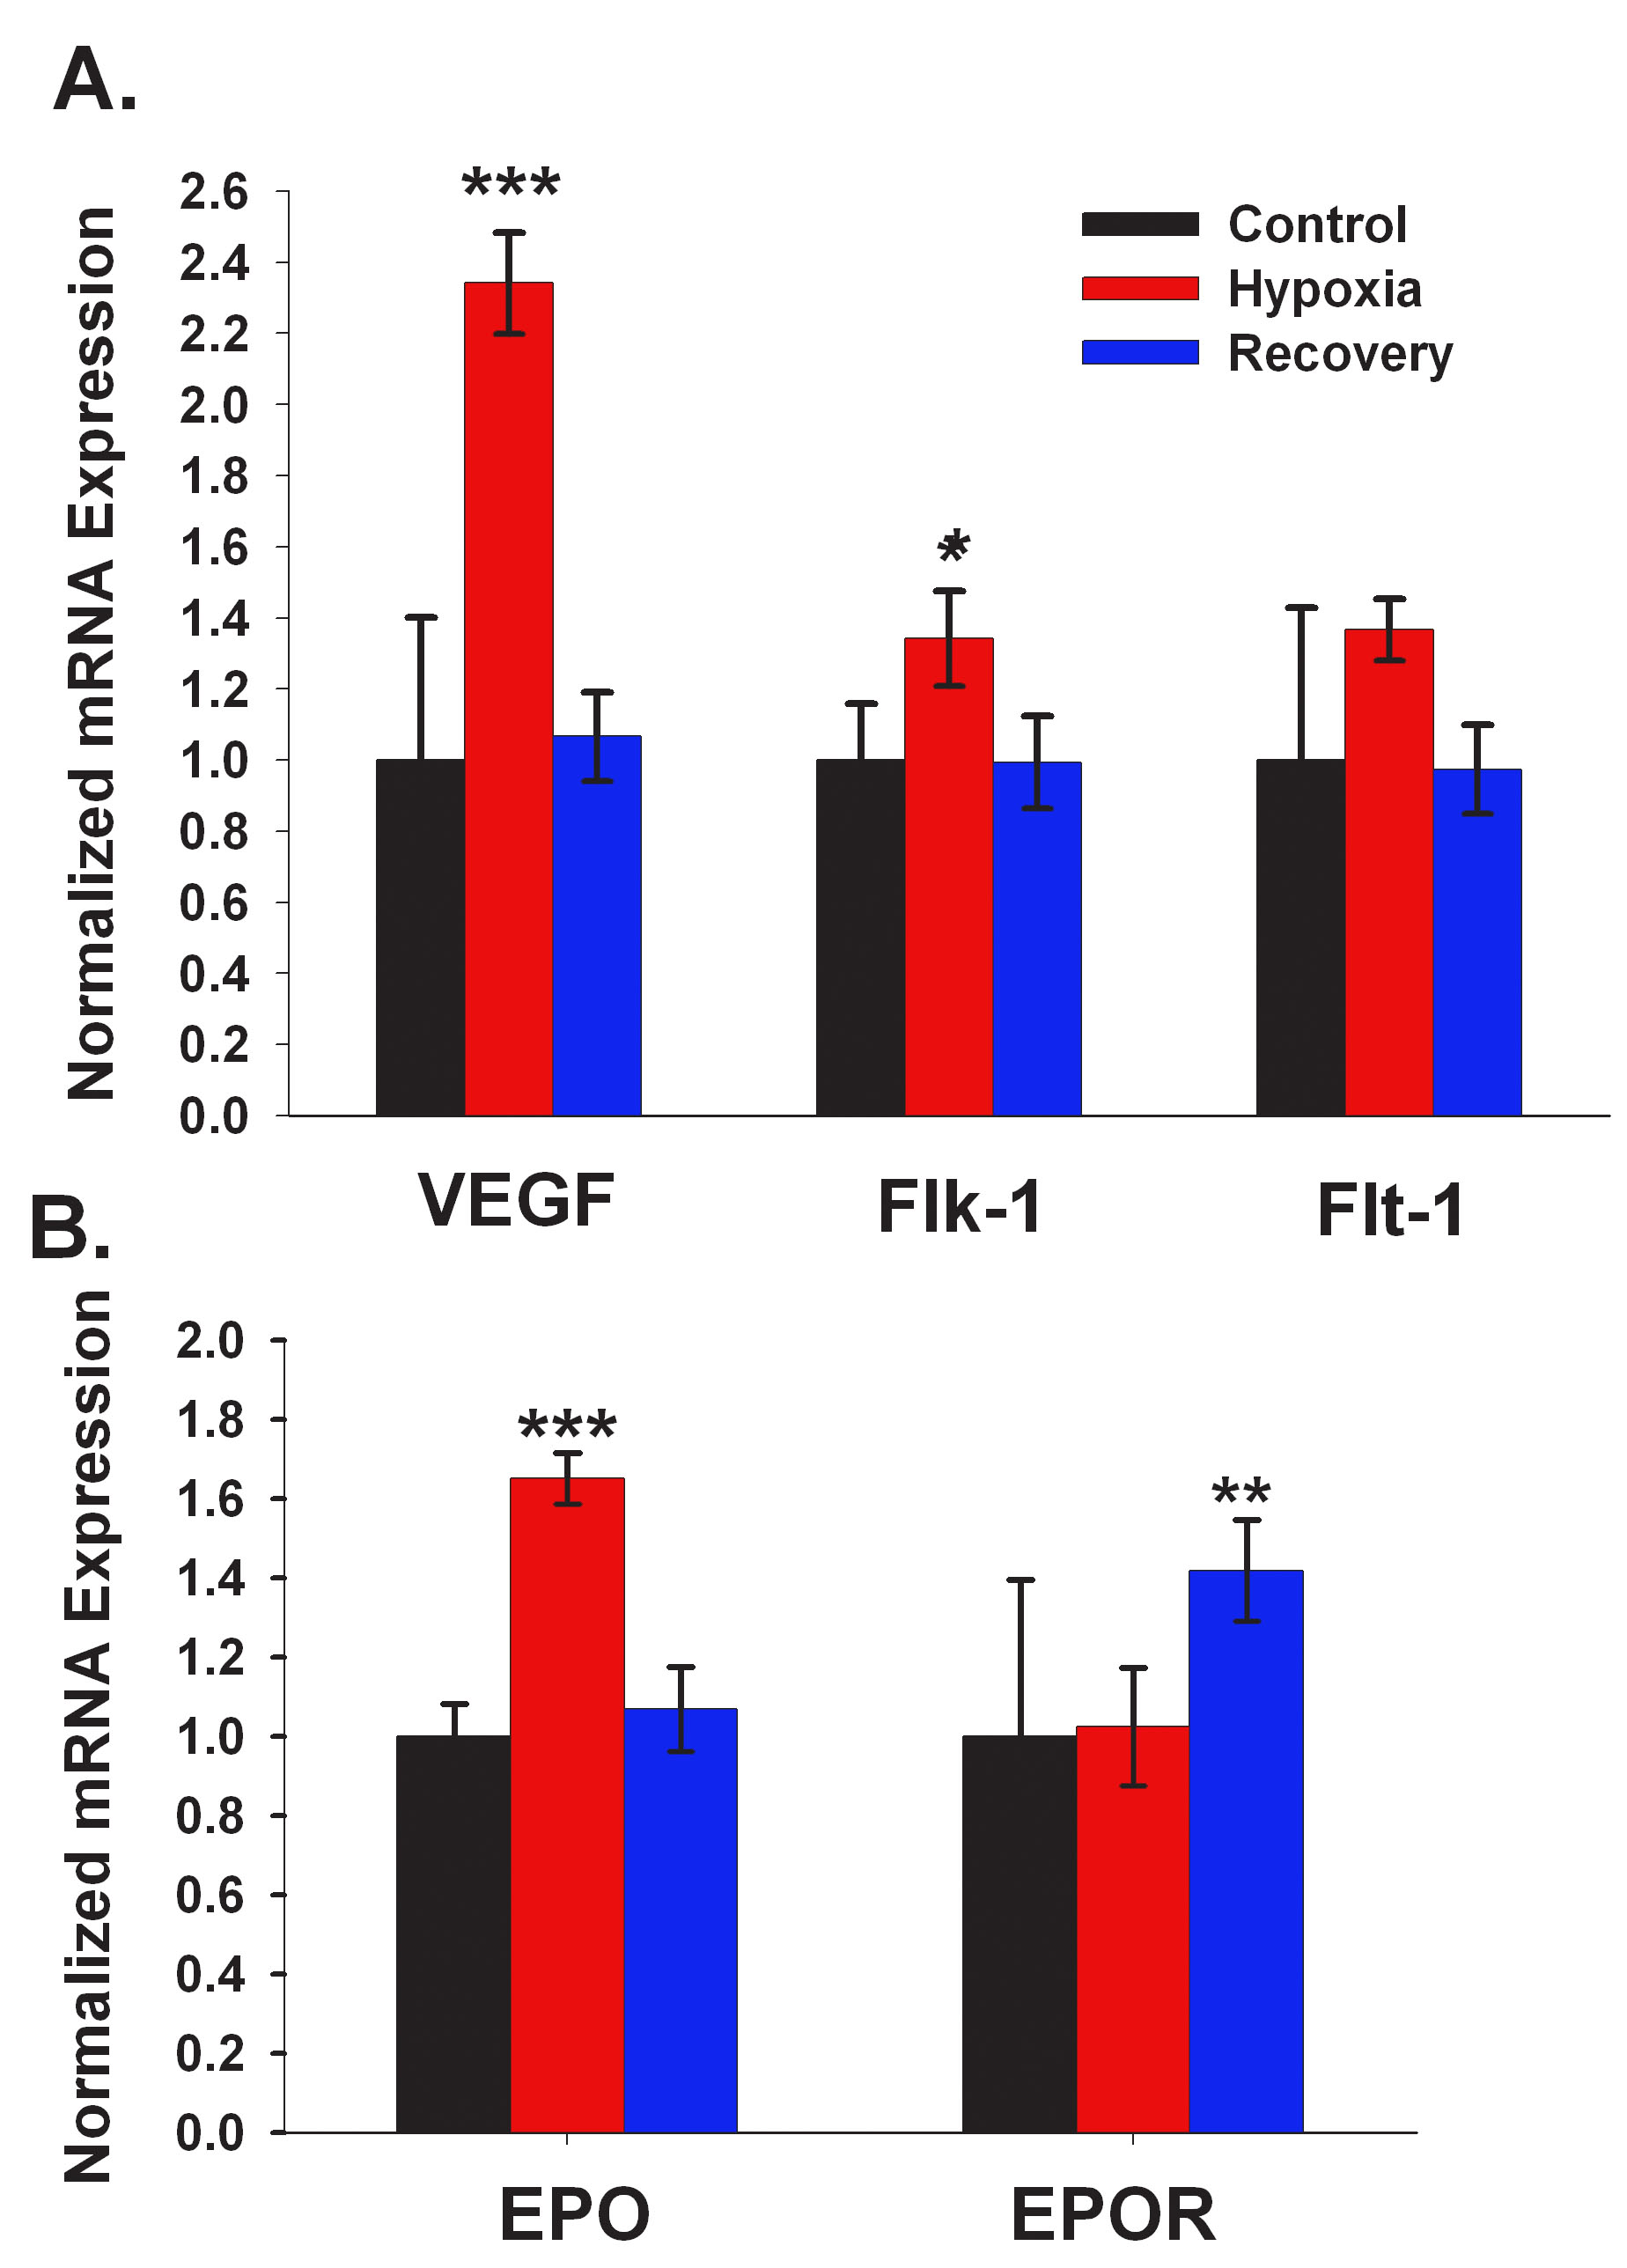
 Figure 2 of Crosson, Mol Vis 2009; 15:296-311.