Figure 1. HIF-1α mRNA and protein expression in rat retina during hypoxia. Rats were exposed to 6%–7% O2 (hypoxia) for varying durations up to 6 h. A: HIF-1α mRNA abundance, normalized to acidic ribosomal protein P0 mRNA, was calculated by qRT–PCR. Data represent mean (±SD)
of 3 independent experiments. No significant differences (n/s; p>0.05) were observed between control and hypoxic HIF-1α mRNA
expression levels at any time point. B: Quantitation of HIF-1α protein expression in nuclear protein extracts by western analysis. Data represent mean (±SD) of at
least 3 independent experiments and were normalized to β-actin expression levels. HIF-1α protein levels were higher in all
hypoxic samples relative to controls (ANOVA followed by post-hoc test; p<0.05) but were not different between any two hypoxic
time points. The inset depicts the western result from a representative time course experiment, as well as the return of HIF-1α
protein levels to control levels 24 h after exposure to 3 h hypoxia.
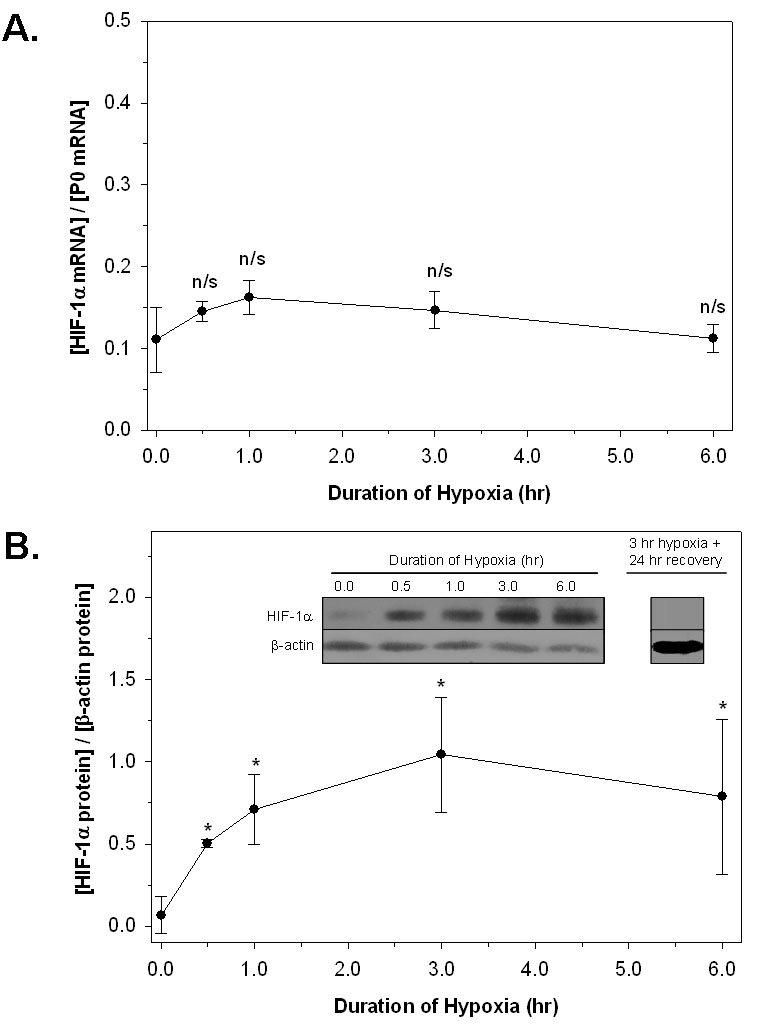
 Figure 1 of
Crosson, Mol Vis 2009; 15:296-311.
Figure 1 of
Crosson, Mol Vis 2009; 15:296-311.