Figure 3. Teratogenic effects of influenza B virus infection in the mouse embryo model. A and F are from sham-infected control embryos. B-E and G-K are from virus-infected embryos. A-G are wholemount embryo preparations. J-K are embryo tissue sections. A: A mouse embryo showing normal development at E9.5 after sham infection at E5.0. B: Reduction of embryo size in 3 virus-infected embryos as compared to the sham-infected control in A at the same gestation stage. C: The blue signals indicate the localization of viral RNA in neuroepithelium and as indicated by arrowheads, in an infected
mouse embryo. D: An example of abnormal optic vesicle (indicated with arrowhead), as compared to the normal optic vesicle in A (indicated with arrow) at the same gestation stage. E and G: Twisted head neuroepithelium and trunk neural tube (indicated by arrowheads) as compared to the normal neural tube in F. H: Viral RNA distribution in embryonic endoderm (indicated by arrowheads). I: Viral RNA distribution in the amniotic membrane (indicated by arrows) and in placenta (indicated by arrowheads). J: Viral RNA distribution in trunk surface ectoderm (indicated by arrowheads) and in the neural tube (indicated by an arrowhead).
K: A negative control for the in situ hybridization procedures showing no background signals. Gestation stages of embryos:
A-G, E9.5; H, E6.0; I and J, E6.5. Abbreviations: ba, branchial arch; ee, embryonic endoderm; etc, ectoplacental cone; fb, forebrain; hb, hindbrain;
ht, heart; nt, neural tube; mes, mesenchyme; opv, optic vesicle; ov, otic vesicle; pl, placenta. Scale bars: A, B, C, and E, 500 μm; F and G, 50 μm; H-K, 100 μm.
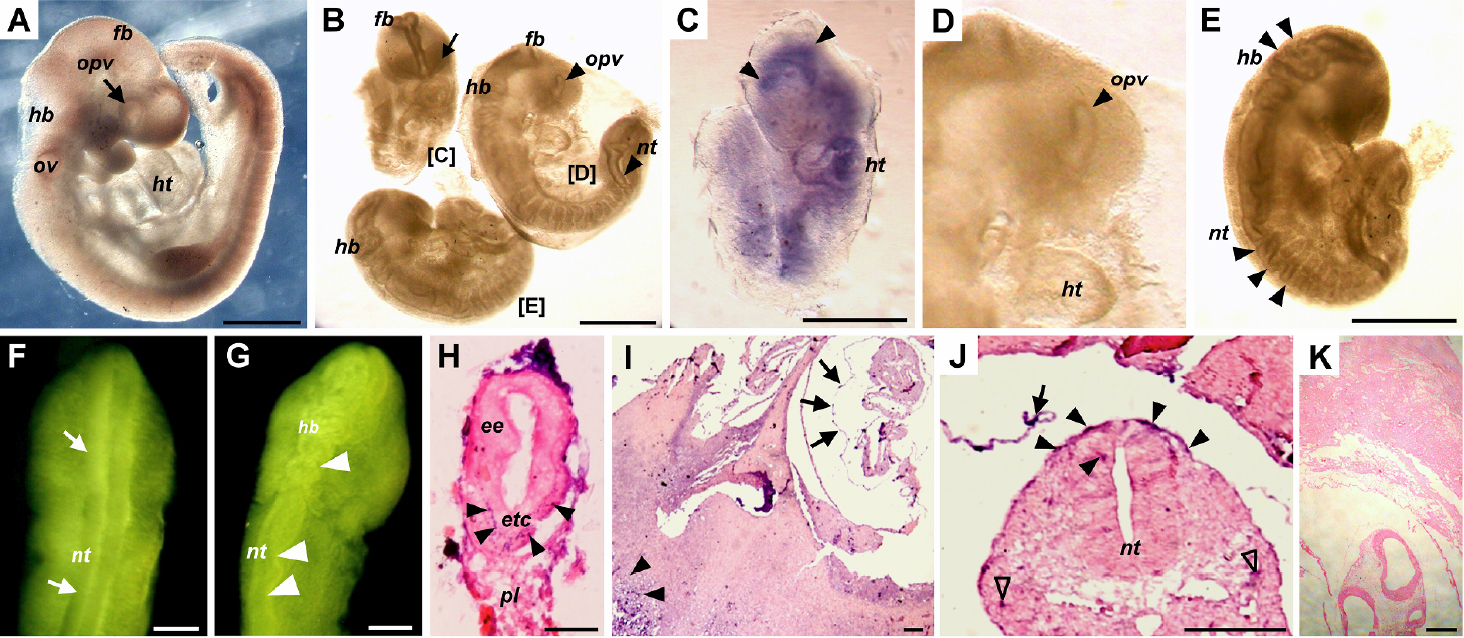
 Figure 3 of
Chen, Mol Vis 2009; 15:2821-2828.
Figure 3 of
Chen, Mol Vis 2009; 15:2821-2828.