Figure 2. Teratogenic effects of influenza B virus infection in the chick embryo model. The images in A-J are from the same embryo, and those in K-R are from another embryo. A-J: A virus-infected embryo at Hamburger-Hamilton stage 15 showing gross malformations (A-D), localization of viral RNA on whole mount preparation (E and F) and on tissue sections (G-J). K-R: Distribution of HNK-1 positive neural crest cells in a virus-infected embryo at Hamburger-Hamilton stage 13 showing neural
crest cell population in the dorsal view (K), ventral view (L), lateral views (M and N), and in tissue sections (O-R). S and U: Forebrain and hindbrain sections of a sham-infected control embryo at Hamburger-Hamilton stage 15 showing few apoptotic
cells. T and V: Extensive and unilateral distribution of apoptotic cells in the forebrain and hindbrain sections of a virus-infected embryo
at Hamburger-Hamilton stage 15. W: A negative control for TUNEL assay on sham-infected embryo corresponding to S and showing no background signals. X: A negative control for TUNEL assay on virus-infected embryo corresponding to T and showing no background signals. A and B: Lateral view of asymmetric eye development (indicated by white arrowhead and white arrow) and twisted neural tube in the
same embryo. C and D: Magnified head region showing asymmetric eye development. E (on focus) and F (out of focus): Asymmetric eye development and unilateral distribution of viral RNA as shown by the blue signals on the same
focus plane. G-J: Areas of transverse sections as indicated in E, showing evident unilateral distribution of viral RNA in the head mesenchyme (indicated by arrow). Note that viral RNA was
concentrated on the side of eye malformation (indicated by arrowheads in H). K-N: Asymmetric distribution of neural crest cells in a virus-infected embryo. The normal eye (arrow-indicated) was surrounded
by more neural crest cells than the malformed eye (arrowhead indicated). O-R: more evident asymmetric neural crest cell distribution, as shown in blue signals, was seen on sections of the areas indicated
in M. The asterisk in O indicates unilateral shortage of neural crest cells as compared to the other side. T and V: More apoptotic cells were detected in the surface ectoderm, neuroepithelium, and mesenchyme as compared to the sham-infected
controls (S and U). Abbreviations: ba, branchial arch; fb, forebrain; hb, hindbrain; ht, heart; mb, midbrain; mes, mesenchyme; ov, otic vesicle.
Scale bars: F and N, 200 μm; J and R: 100 μm; V and X, 50 μm.
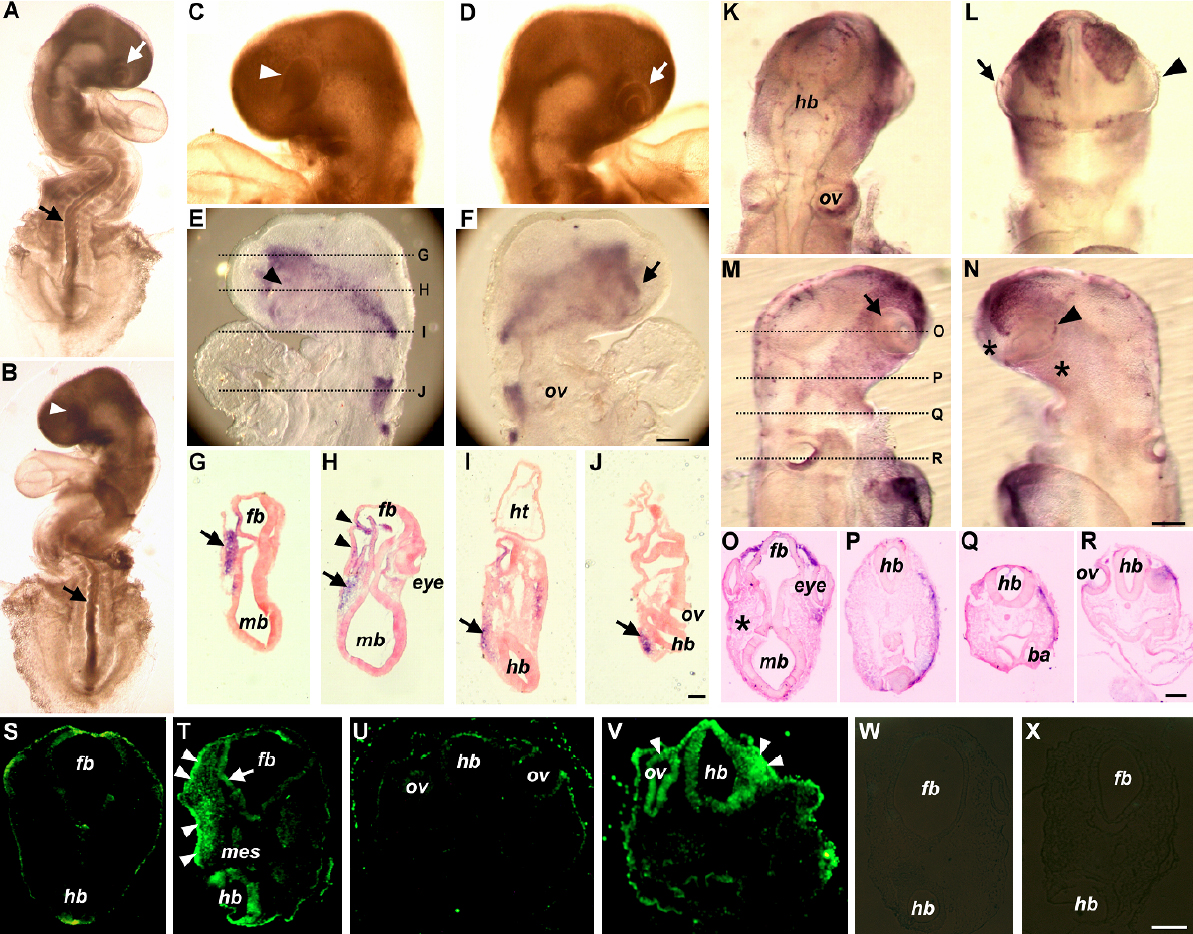
 Figure 2 of
Chen, Mol Vis 2009; 15:2821-2828.
Figure 2 of
Chen, Mol Vis 2009; 15:2821-2828.