Figure 3. DNA sequence chromatograms. DNA sequence chromatograms of the unaffected members and affected members in an autosomal dominant
nuclear cataract family. A single transition is observed at position 92 (T>C) as a T/C double peak (indicated by an arrow).
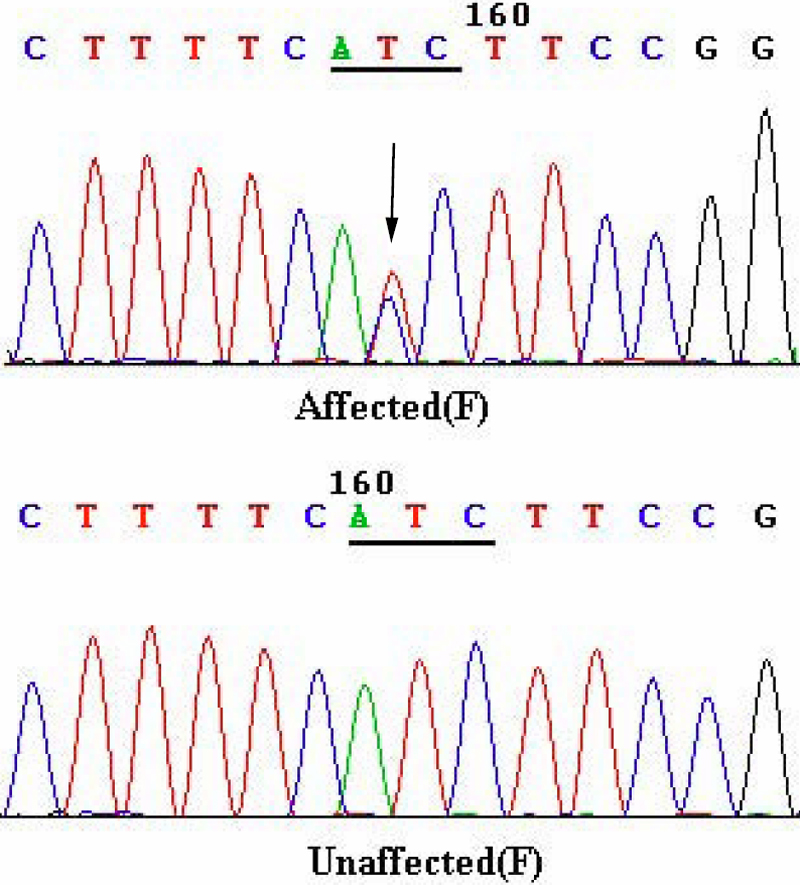
 Figure 3 of
Wang, Mol Vis 2009; 15:2813-2820.
Figure 3 of
Wang, Mol Vis 2009; 15:2813-2820.