Figure 5. Pharmacokinetics of
intravitreally injected bevacizumab and chicken IgY in rats. A–C
show the distribution in rat eyes of chicken IgY in the whole retina (A),
around
the retinal blood vessel (B), and in the choroid (C)
5 h post intravitreal injection as determined by Alexa dye labeled
antibodies (red). D–F show the distribution in rat eyes
of bevacizumab in the whole retina (D), around the retinal blood
vessel (E), and in the choroid (F) 5 h post intravitreal
injection as determined by Alexa dye labeled antibodies (red).
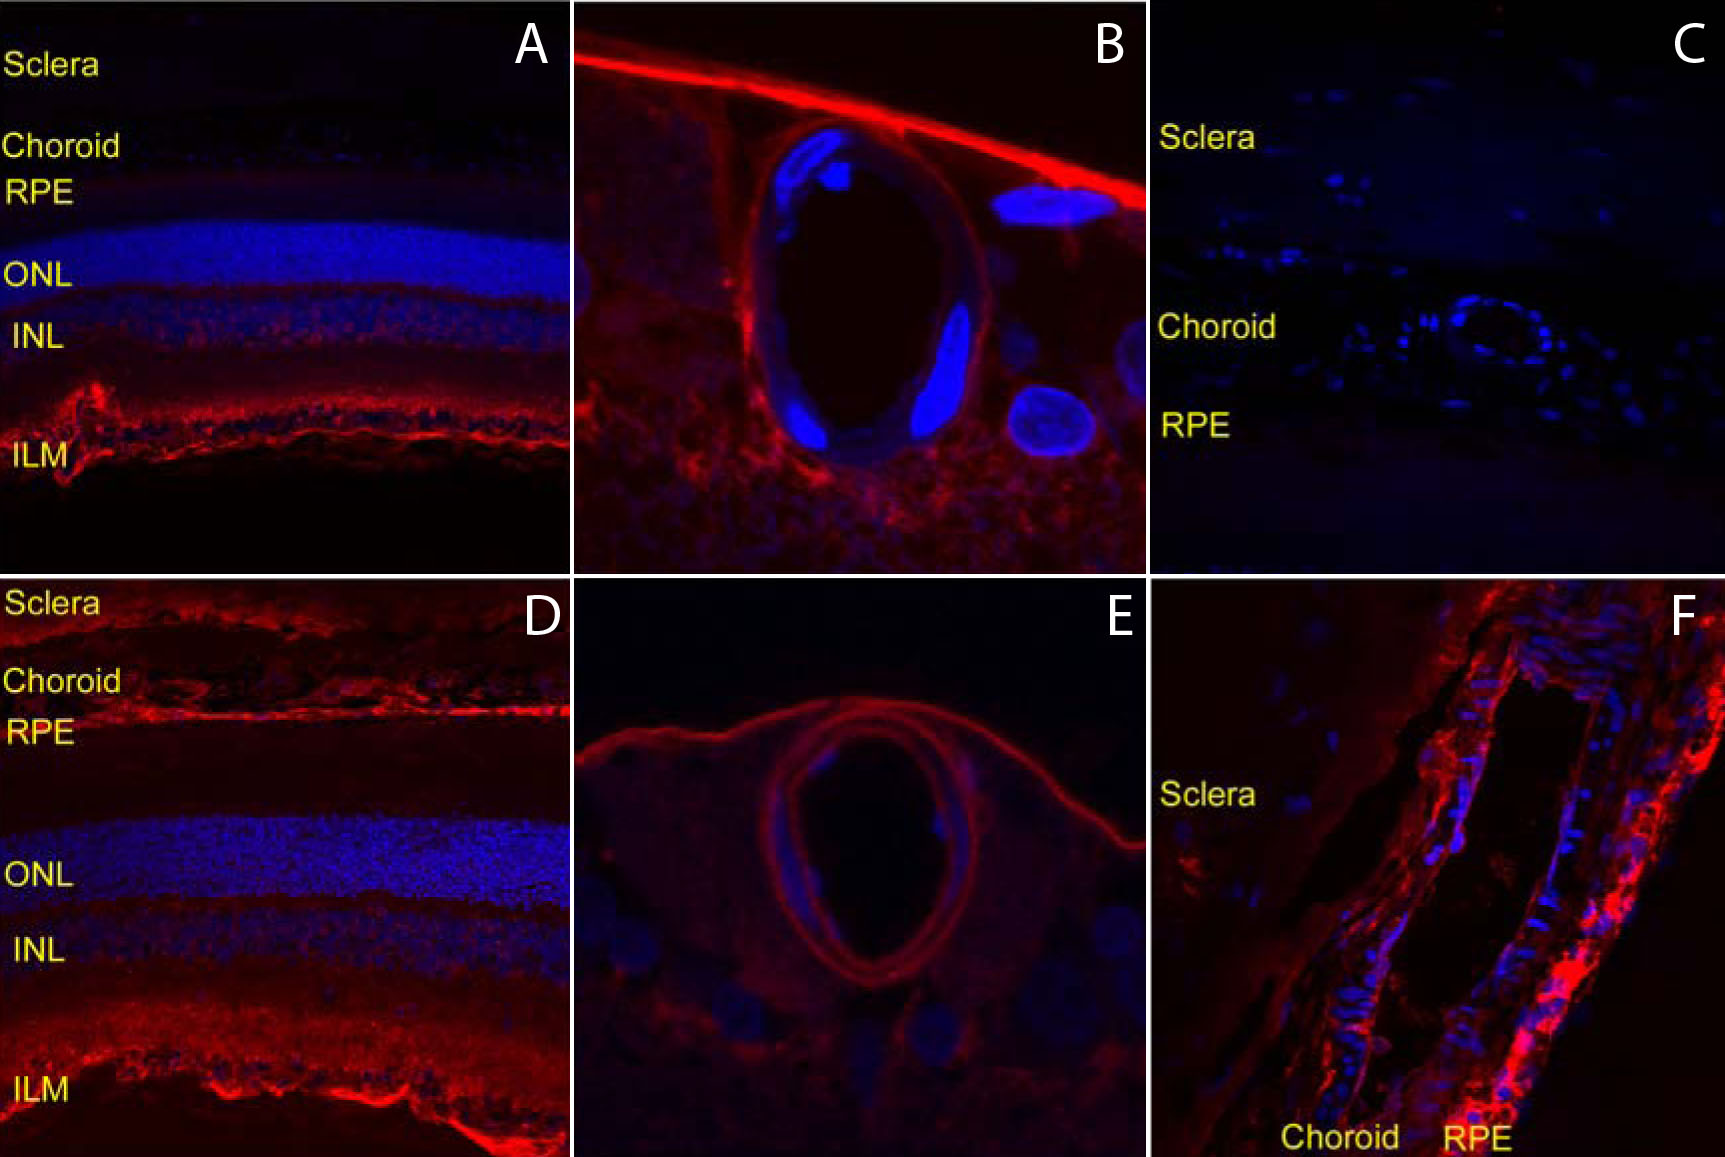
 Figure 5 of Kim, Mol Vis 2009; 15:2803-2812.