Figure 4. Distribution of intravitreally
injected bevacizumab in the FcRn knockout and wild-type mice. A
and B show the distribution of intravitreally administered
bevacizumab (green) around retinal blood vessels in an FcRn knockout
mouse and wild-type mouse 5 h post injection, respectively. C
shows the normalized fluorescent intensity across the retinal vascular
endothelium in a wild-type mouse. Arrows in B indicate the
direction over which the fluorescence profiles were obtained. The
normalized fluorescence intensity profile in panel C shows a
fluorescence intensity gradient across the retinal vascular endothelium
from the abluminal to luminal sides, indicating the penetration of
bevacizumab into the blood system in the wild-type mouse. A, B:
Cell
nuclei were stained with DAPI (blue).
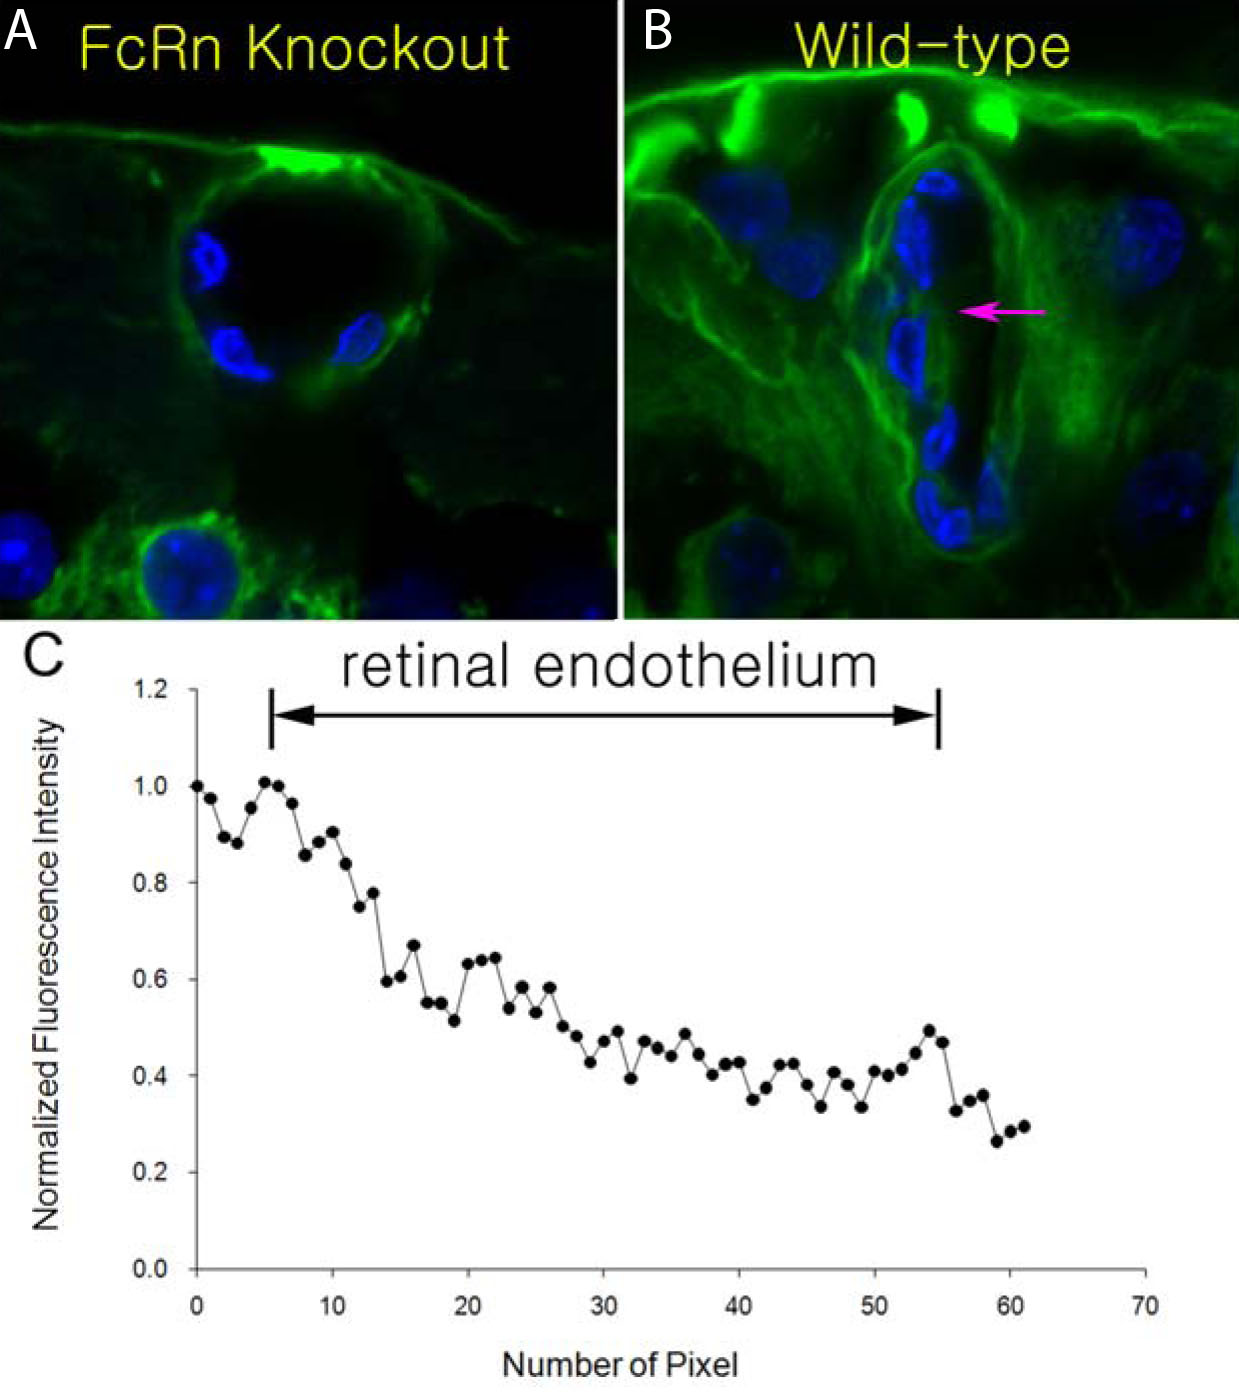
 Figure 4 of Kim, Mol Vis 2009; 15:2803-2812.