Figure 4. These images show the effect of RSK2 siRNA on the expression of actin and MAPK. A: siRNAs of RSK2 were transfected into NIH3T3 cells. Twenty-four hours later, cells were treated with or without 0.33 μg/ml bFGF for 24 h.
RT-PCR analysis was performed for actin mRNA. The upper panel shows PCR product of actin that were separated by electrophoresis in 1.5% agarose gel. The lower panel shows the PCR products of GAPDH as an internal control. B: The whole cell extract was applied to 7.0% polyacrylamide gel (SDS-PAGE) and blotted with anti-actin antibody (upper panel).
Blot with anti-α tubulin antibody shows the standardized loaded volume (lower panel). C: The whole cell extract was also applied to 8.0% polyacrylamide gel (SDS-PAGE) and blotted with anti-phosphorylated MAPK
(p-MAPK) antibody (upper panel) and anti-non phosphorylated MAPK antibody (middle panel).
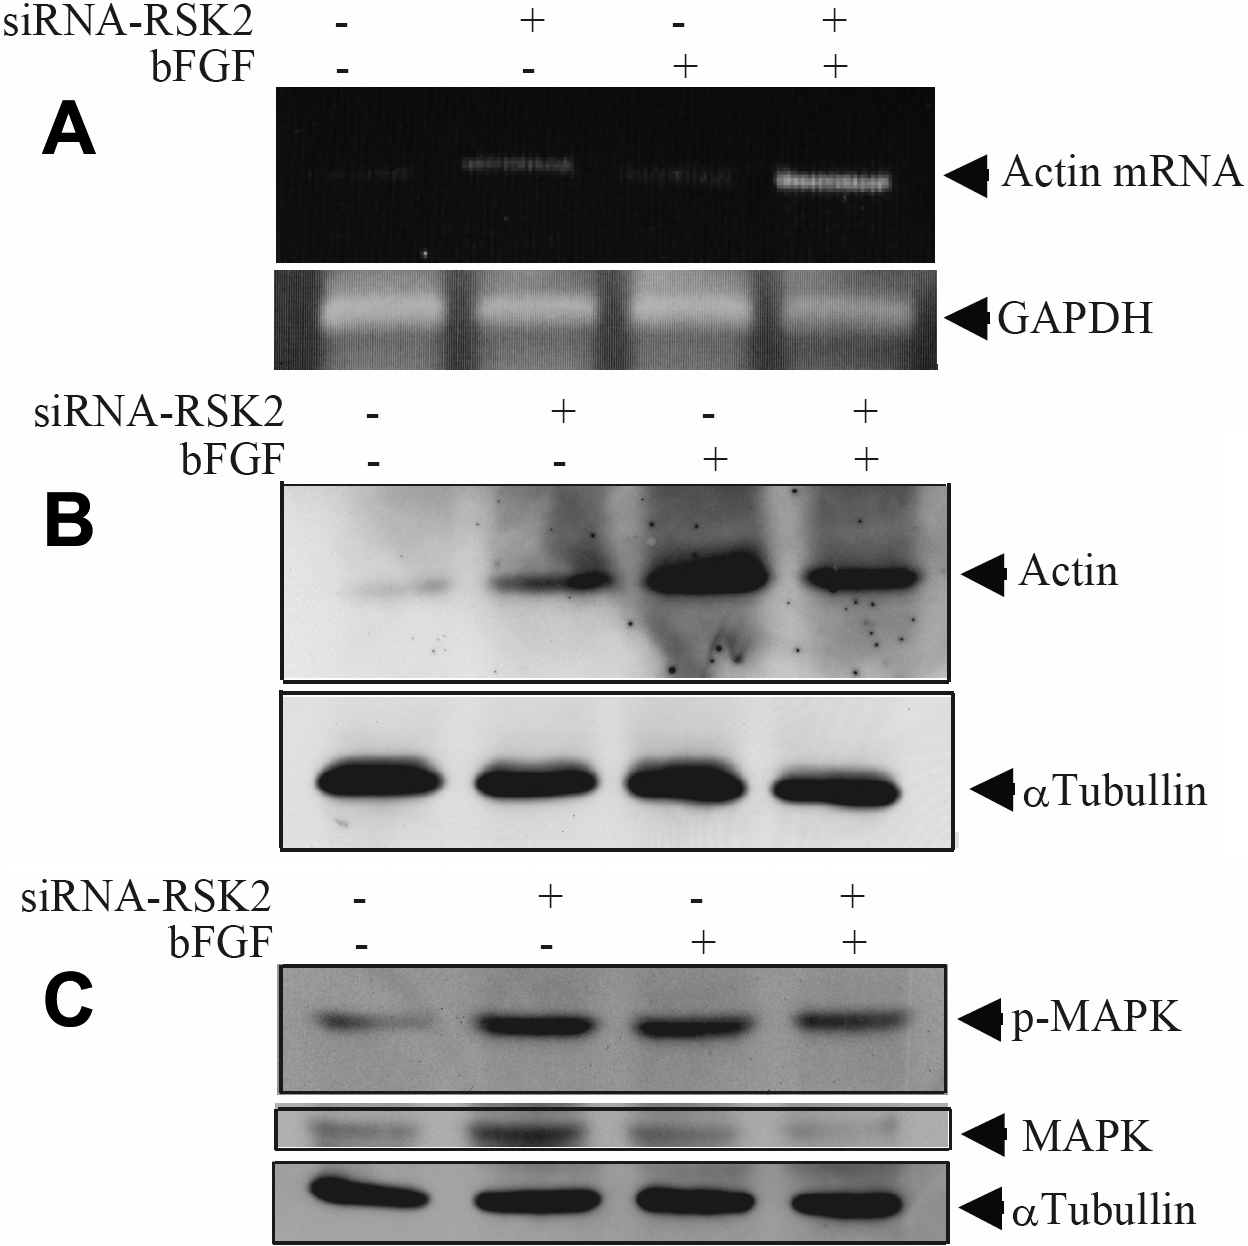
 Figure 4 of
Kanamoto, Mol Vis 2009; 15:2762-2770.
Figure 4 of
Kanamoto, Mol Vis 2009; 15:2762-2770.