Figure 5. Impact of yellow IOL on the
light-induced retinal morphological changes. A: (Upper)
Representative images of TUNEL staining for retinal sections 1 mm
superior to the optic nerve head on postoperative day 3 (2 days after
the light exposure [5,000 LUX, 24 h]). (Lower) Merged images. Nuclei
were counterstained with Hoechst 33258. Bar represents 50 µm. B:
Quantification of TUNEL-positive cells in the ONL of each section,
including the optic nerve head. Values are mean ±SD (n=6 in each group;
*p<0.05). C: Representative images of hematoxylin and eosin
staining for retinal sections 1 mm superior to the optic nerve head on
postoperative day 7 (6 days after the light exposure [5,000 LUX, 24
h]). Bar represents 50 µm. D: ONL thickness of IOL-implanted
eyes after light exposure. Values are mean ±SD (n=5 to 7; *p<0.05,
**p<0.01).
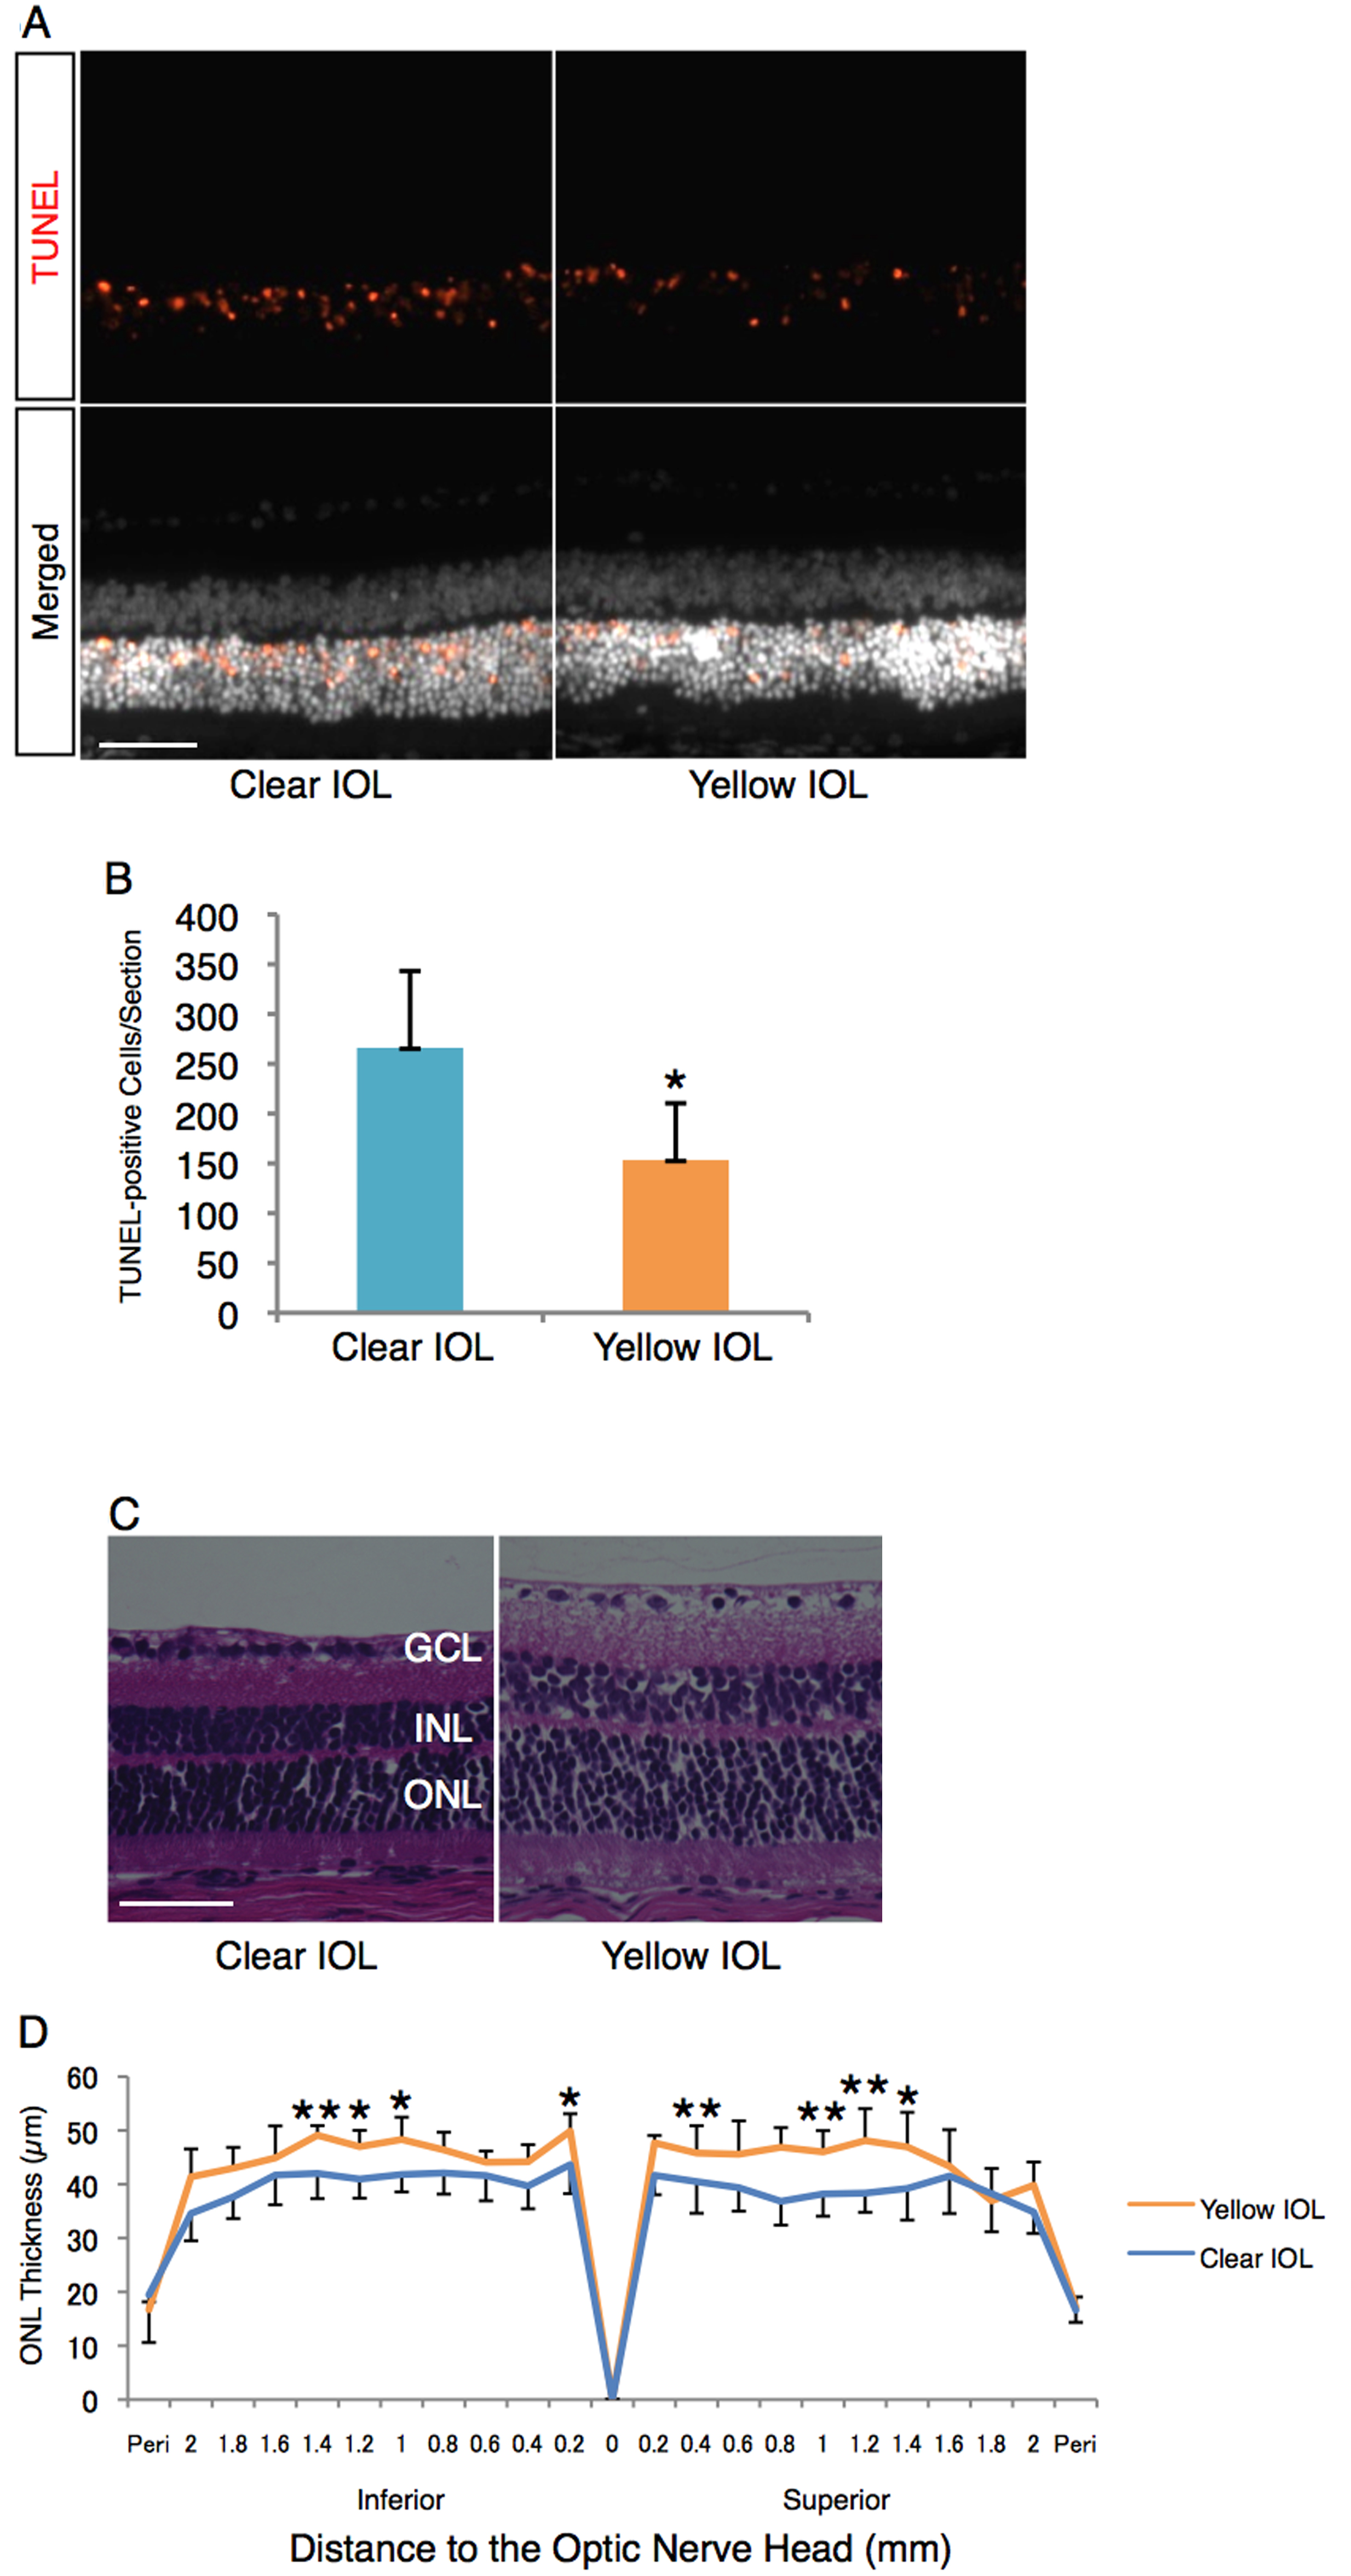
 Figure 5 of Kurihara, Mol Vis 2009; 15:2751-2761.