Figure 2. Genes whose mRNA expression
levels could be validated by real-time RT–PCR. Mean relative expression
values ±SD (n=4) obtained by microarray analysis and mean normalized
expression values obtained by real-time PCR (n=4). The p-values of the
ANOVA's can be seen in the heading of the figures. The fold-changes and
p-values (determined by un-paired Student's t-test as post-hoc
analysis) were computed for the comparison between 30 days and 42 days
old knockout- and wild-type mice (wt/30 versus wt/42 and hm/30 versus.
hm/42) and are shown within the figures. Please note that in the case
of Pcdhb9, the comparison is between the knockout and the
wild-type mice at both ages (wt/30 versus. hm/30 and wt42 versus hm/42).
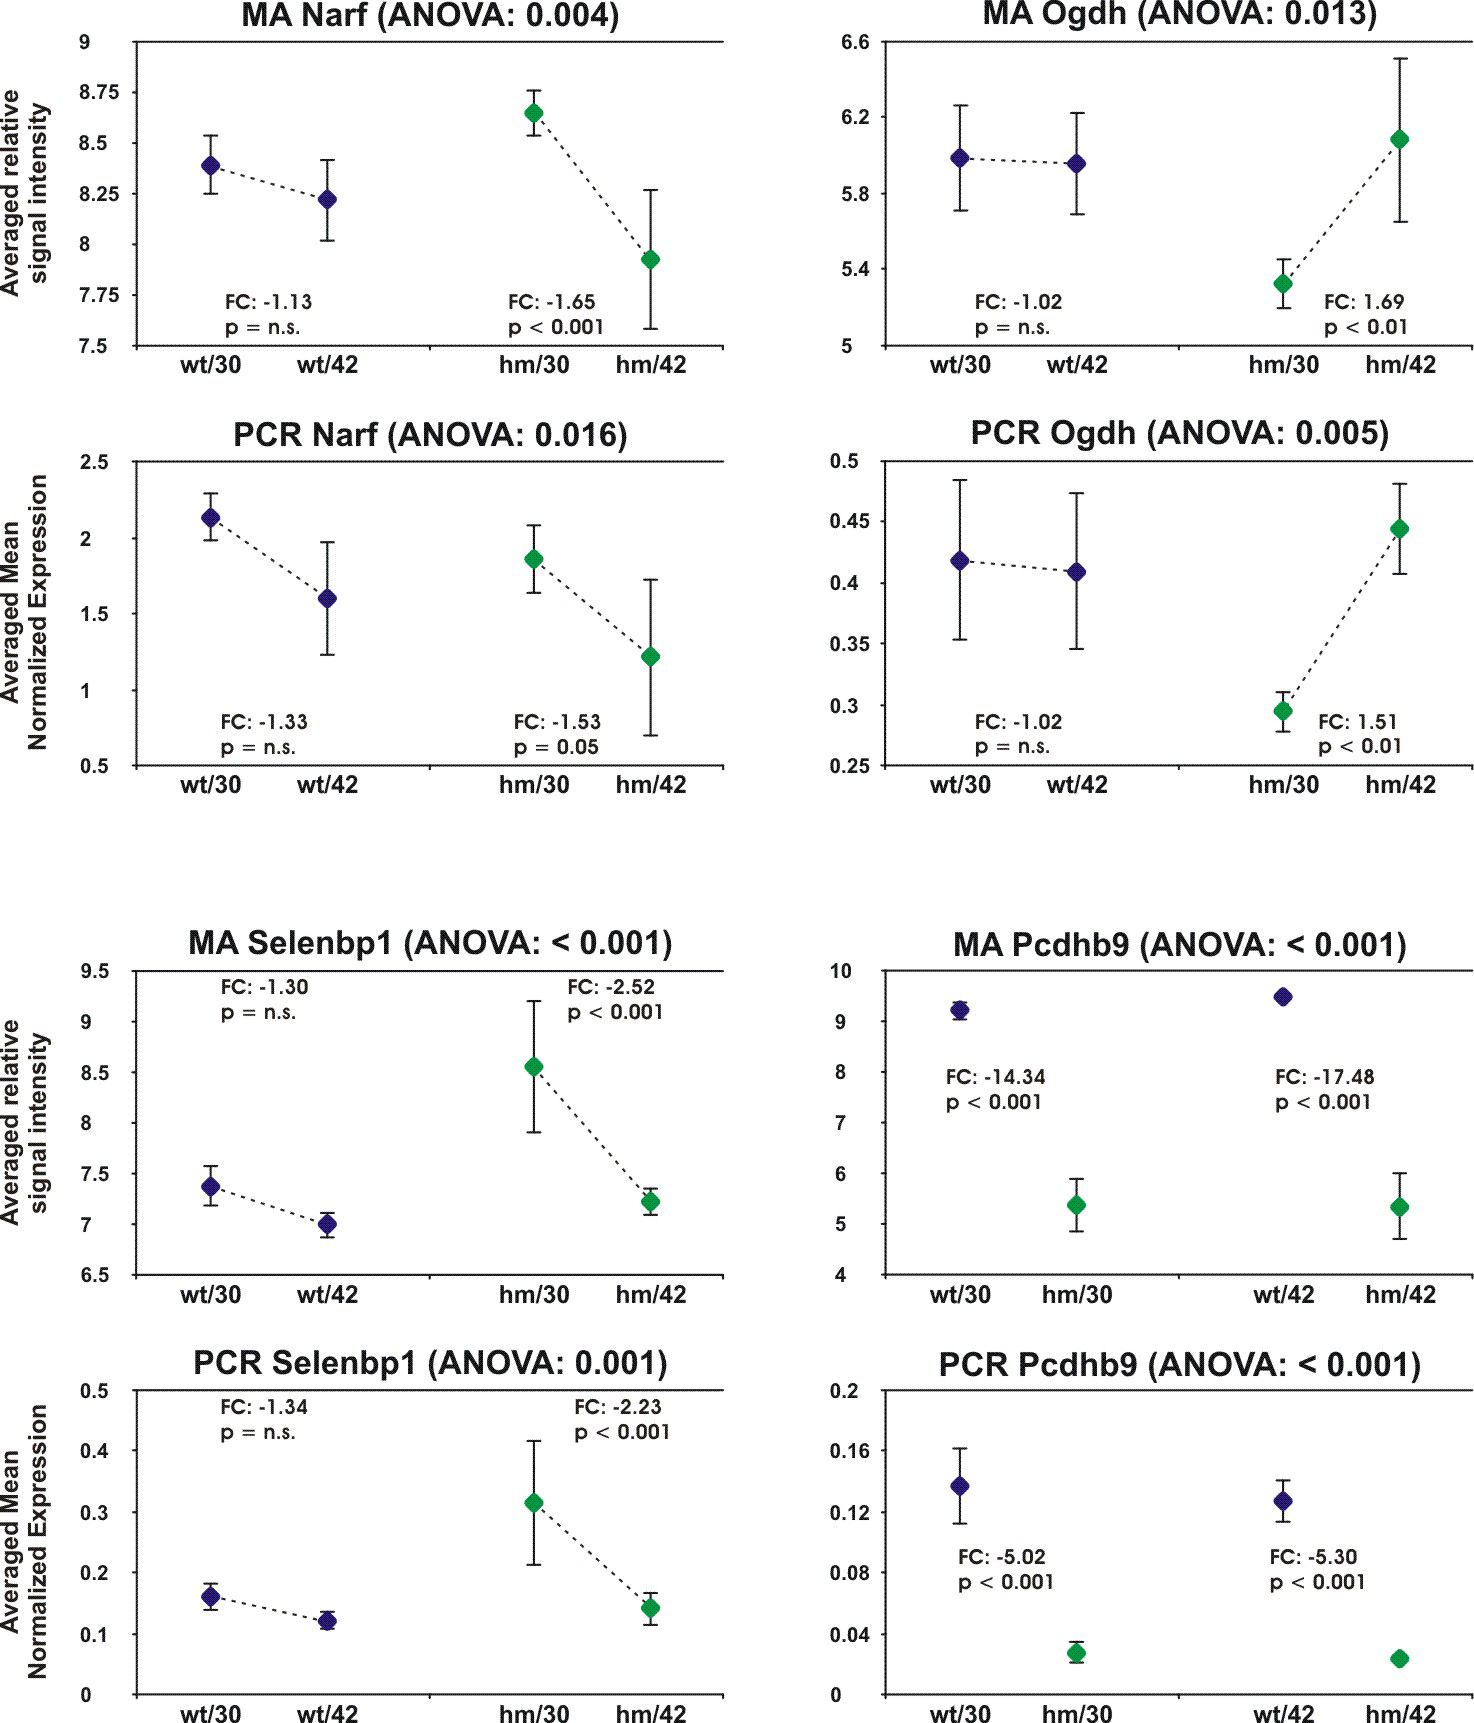
 Figure 2 of Schippert, Mol Vis 2009; 15:2720-2739.