Figure 1. Networks predicted by Ingenuity Pathway Analysis in the homozygous Egr-1 knockout mice. Networks proposed by Ingenuity Pathways
Analysis Software. All genes whose mRNA expression levels were found to be differentially regulated in the knockout mice between
the age of 30 days and 42 days are highlighted in gray. Encircled are those genes that were chosen for validation by real-time
RT–PCR. A detailed legend describing the symbols used in this scheme is enclosed in the figure. Asterisks denote changes in
gene expression that were validated using real-time PCR.
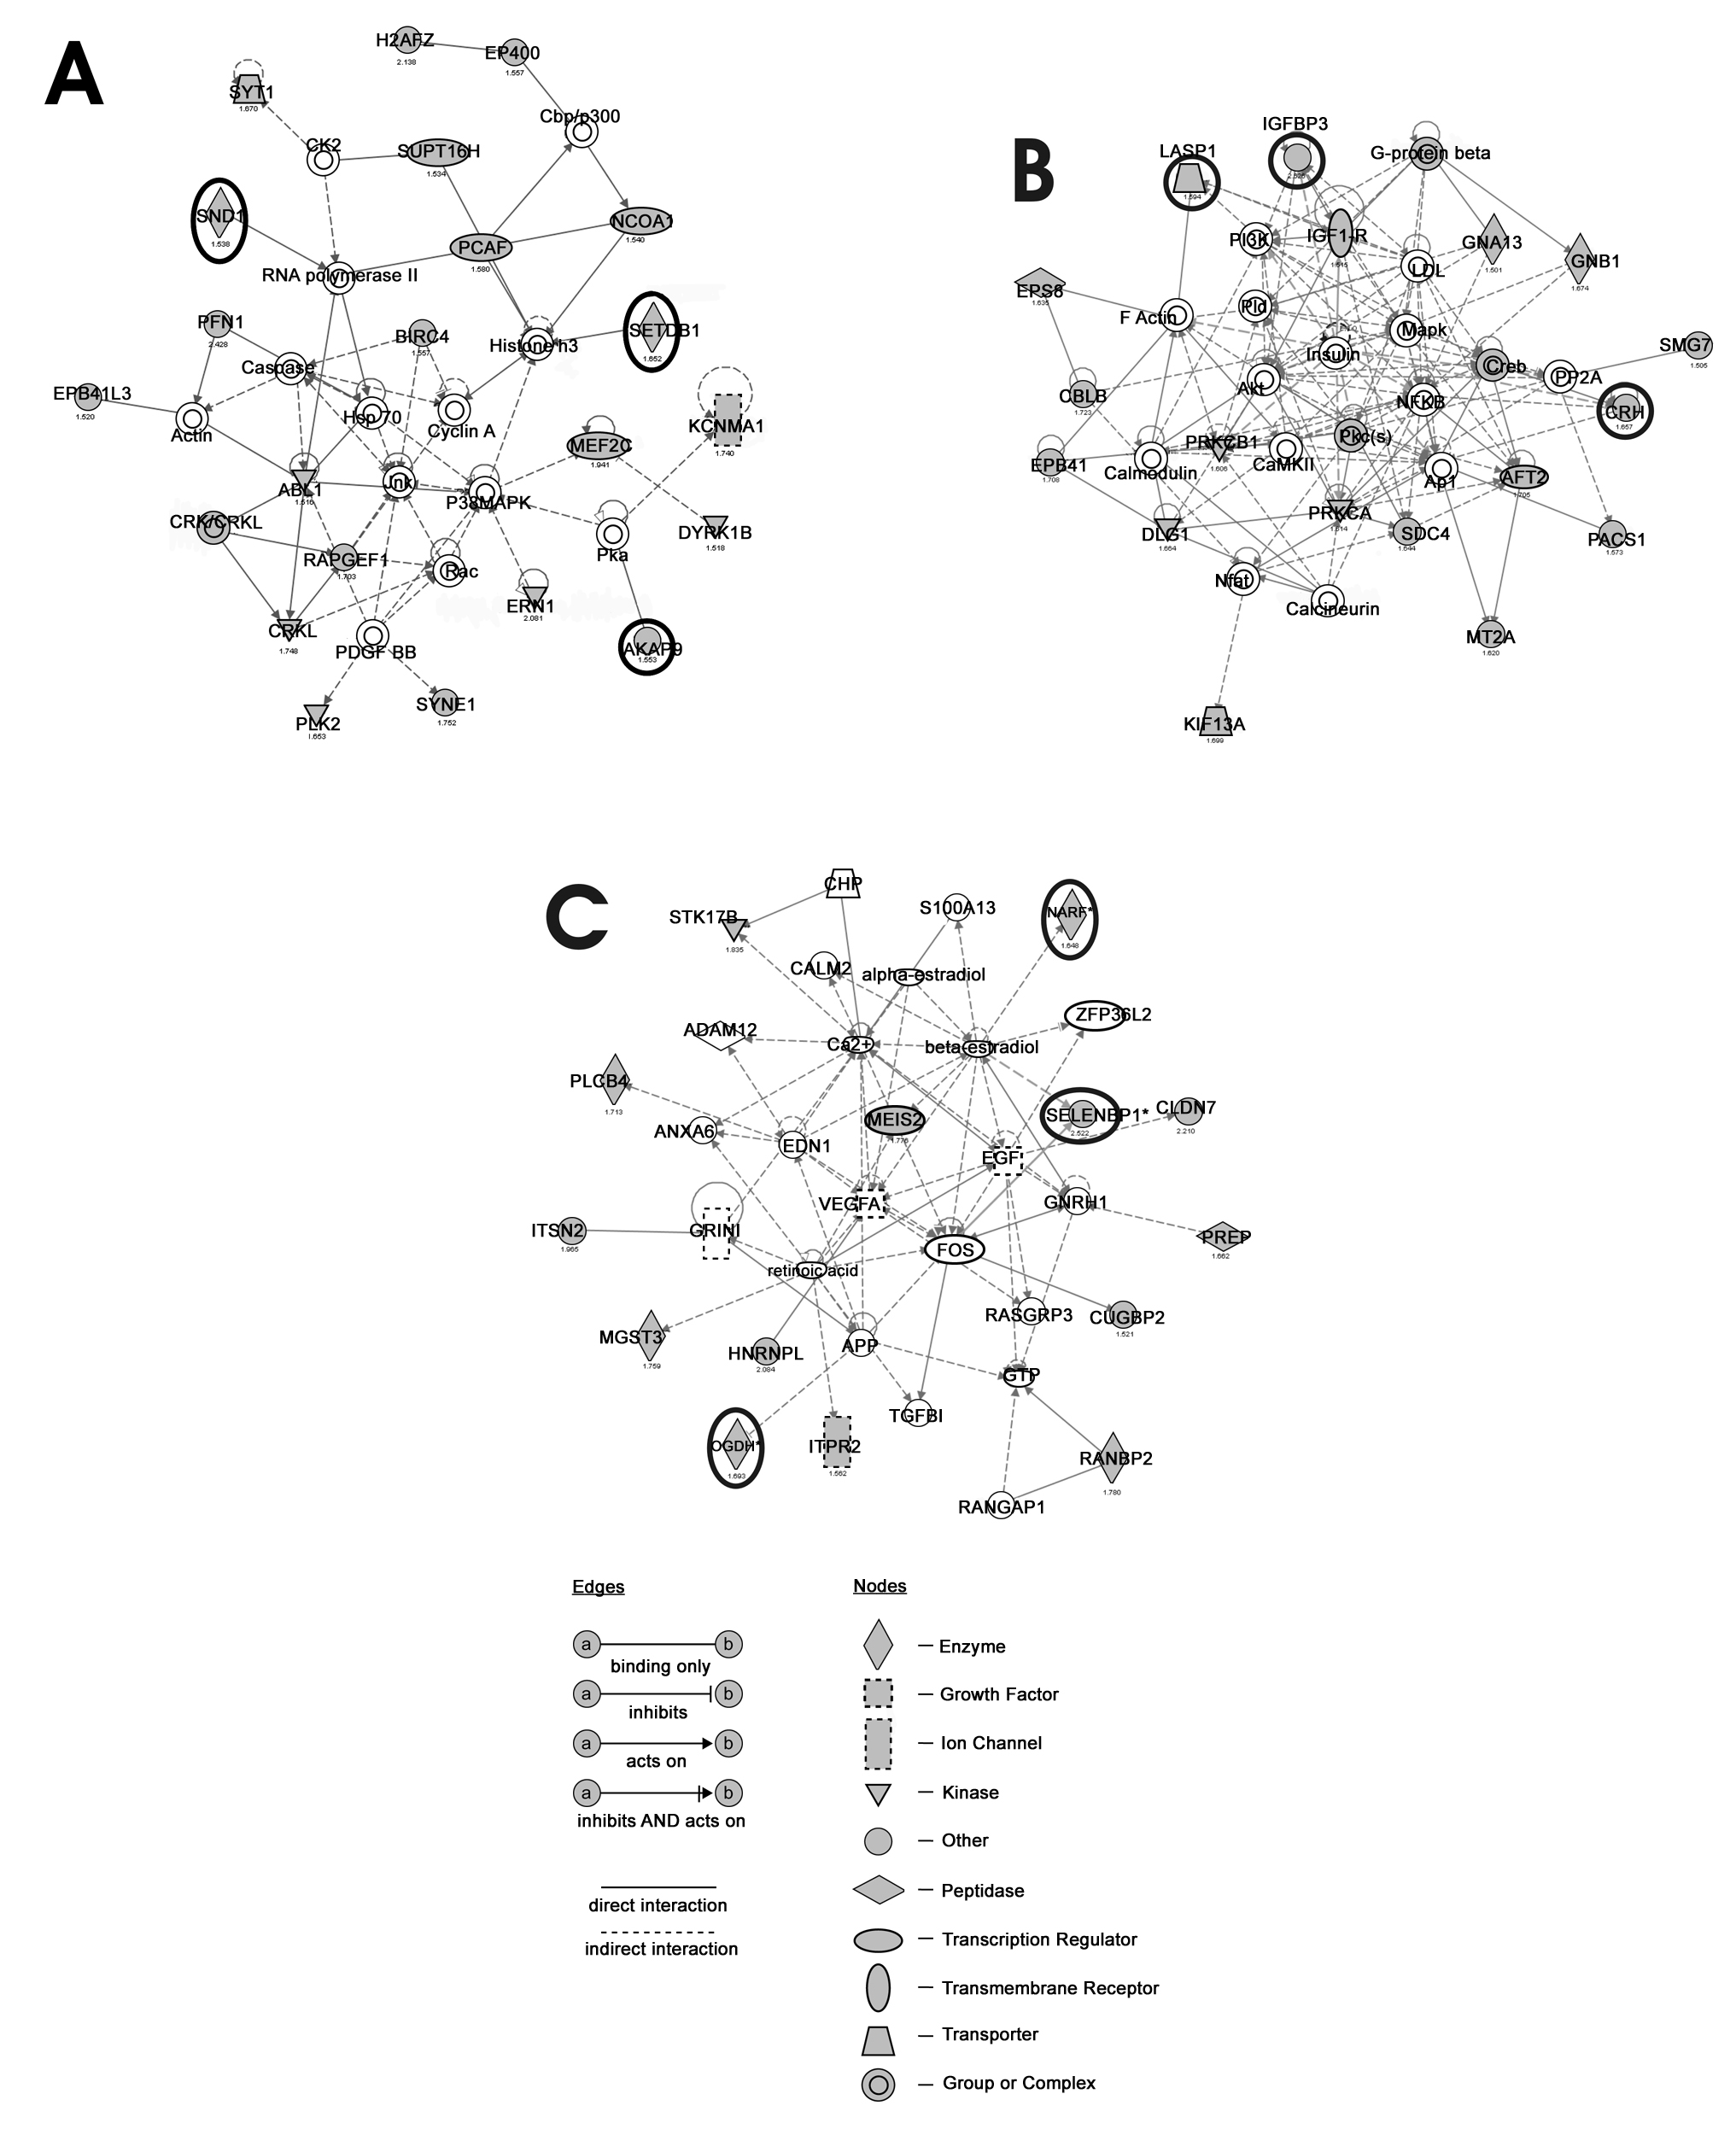
 Figure 1 of
Schippert, Mol Vis 2009; 15:2720-2739.
Figure 1 of
Schippert, Mol Vis 2009; 15:2720-2739.