Figure 6. Number of cells per mm located in the INL labeled with PKC-α and Goα antibodies. (A) corresponds to one week of elevated IOP, and (B) to five weeks of elevated IOP (n=40 in all experimental groups). Results are expressed as mean±SEM. Statistically significant
differences were assessed according to Student’s t-test. The two asterisks denote the level of significance, p≤0.01. Abbreviations: intraocular pressure (IOP), protein kinase
C-α (PKC-α).
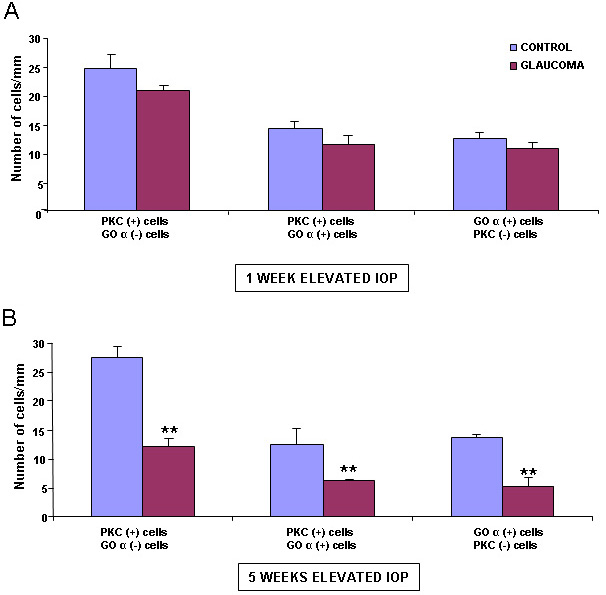
 Figure 6 of
Hernandez, Mol Vis 2009; 15:2696-2709.
Figure 6 of
Hernandez, Mol Vis 2009; 15:2696-2709.