Figure 5. Confocal images of PKC-α, calretinin, bassoon, and Goα immunolocalization. Panels A-D show PKC-α (green), calretinin (red) and DAPI (blue). Panels E-H show PKC-α (green), bassoon (red), and DAPI (blue). Panels I-Q show PKC-α (green), Goα (red), and DAPI (blue). Arrows in B, C, F, G, and I-Q indicate a subpopulation of PKC-α-positive cells, located in the innermost INL, that may be affected by glaucoma. Abbreviations:
ganglion cell layer (GCL), inner nuclear layer (INL), intraocular pressure (IOP), inner plexiform layer (IPL), outer nuclear
layer (ONL), outer plexiform layer (OPL), protein kinase C-α (PKC-α). Scale bar equals 20 μm.
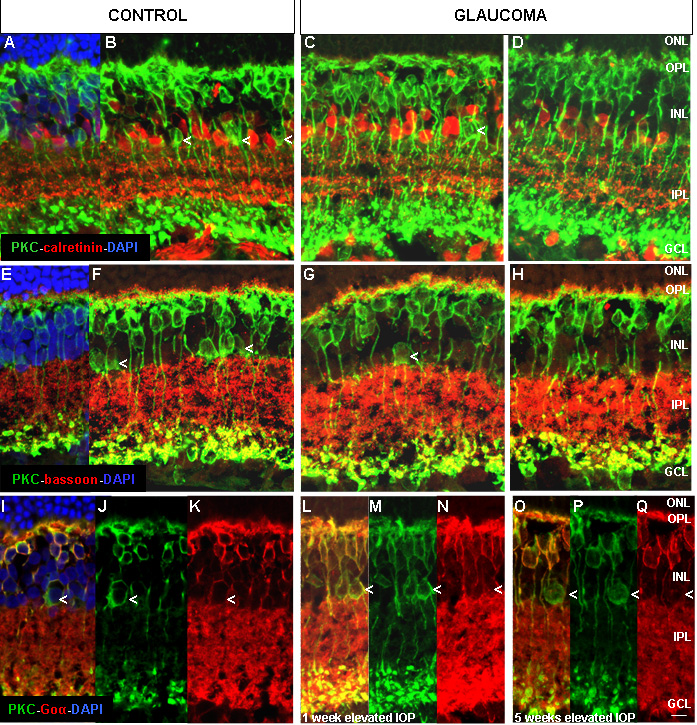
 Figure 5 of
Hernandez, Mol Vis 2009; 15:2696-2709.
Figure 5 of
Hernandez, Mol Vis 2009; 15:2696-2709.