Figure 4. Number of cells/mm labeled with parvalbumin and ChAT antibodies. Panel A depicts the number of amacrine cells, in the inner nuclear layer, labeled with parvalbumin. Panel B shows the number of amacrine cells, in the inner nuclear layer, labeled with ChAT. Panel C shows the number of ChAT positive cells localized in the ganglion cell layer (n=40 in all experimental groups). Statistically
significant differences were assessed according to Student’s t-test. Asterisks denote the level of significance as follows: *p≤0.05 and **p≤0.01. Abbreviations: choline acetyltransferase
(ChAT), ganglion cell layer (GCL), inner nuclear layer (INL).
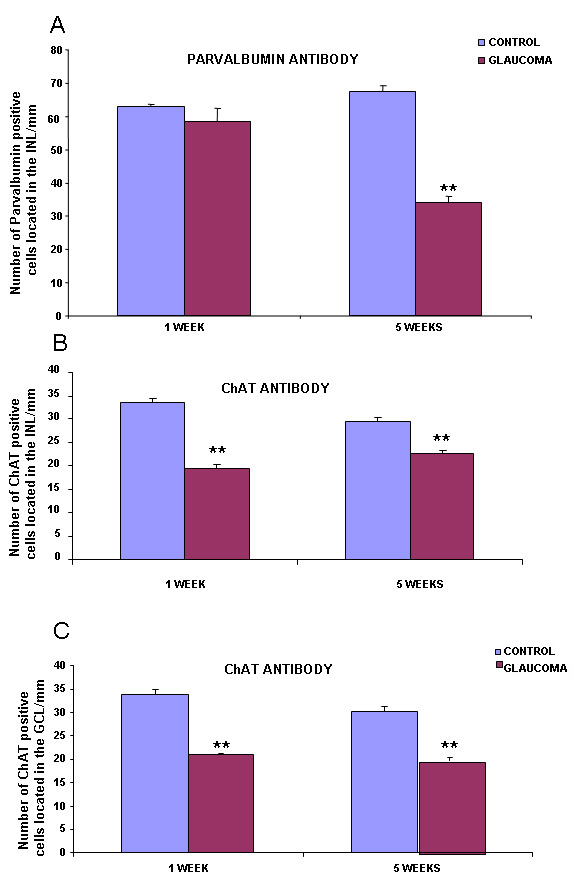
 Figure 4 of
Hernandez, Mol Vis 2009; 15:2696-2709.
Figure 4 of
Hernandez, Mol Vis 2009; 15:2696-2709.