Figure 1. Time-course changes in intraocular pressure (IOP) after experimental glaucoma. Panel A shows the changes in IOP (mmHg) in group 1 (1 week of elevated IOP). Panel B shows the changes in IOP (mmHg) in group 2 (5 weeks of elevated IOP). Blue dots represent control values measured in the
right eye, and purple dots represent experimental values measured in the left operated eye. The results of the IOP reading
were accepted if the confidence interval was greater than or equal to 95%. The mean values of the IOP measurements were eventually
averaged, and results were expressed as mean IOP±SEM. Five such measurements were made. Statistically significant differences
were assessed according to Student’s t-test. Asterisks denote the level of significance as follows: *p≤0.05 and **p≤0.01.
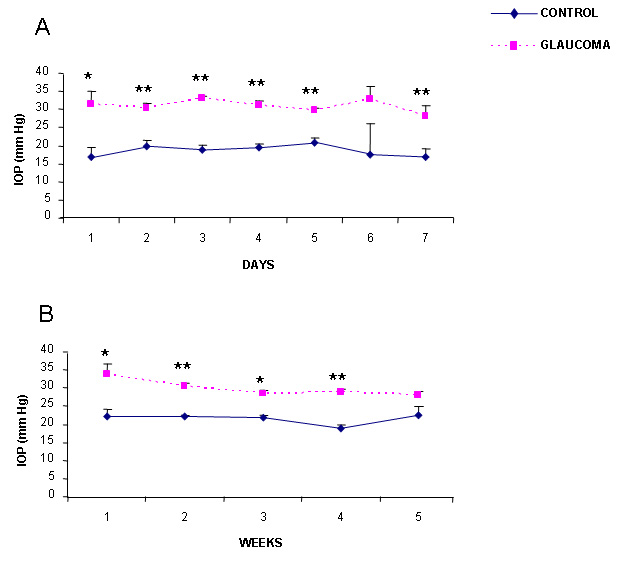
 Figure 1 of
Hernandez, Mol Vis 2009; 15:2696-2709.
Figure 1 of
Hernandez, Mol Vis 2009; 15:2696-2709.