Figure 5. Downregulation of the p27Kip1
protein following PKCα activation. A: Western blot
analysis of RPE cells treated 24 h with 100 nM PMA and 100 nM
thymeleatoxin reveals a strong downregulation of the p27 protein at the
1 h and 3 h time points. Gels show representative results of four
independent experiments. Each well was loaded with 40 µg of protein. B:
Optical
density of P27 protein determined by densitometric imaging is
shown (Mean±SD, n=4). The β-actin band with 42 kDa is used for
quantitation.
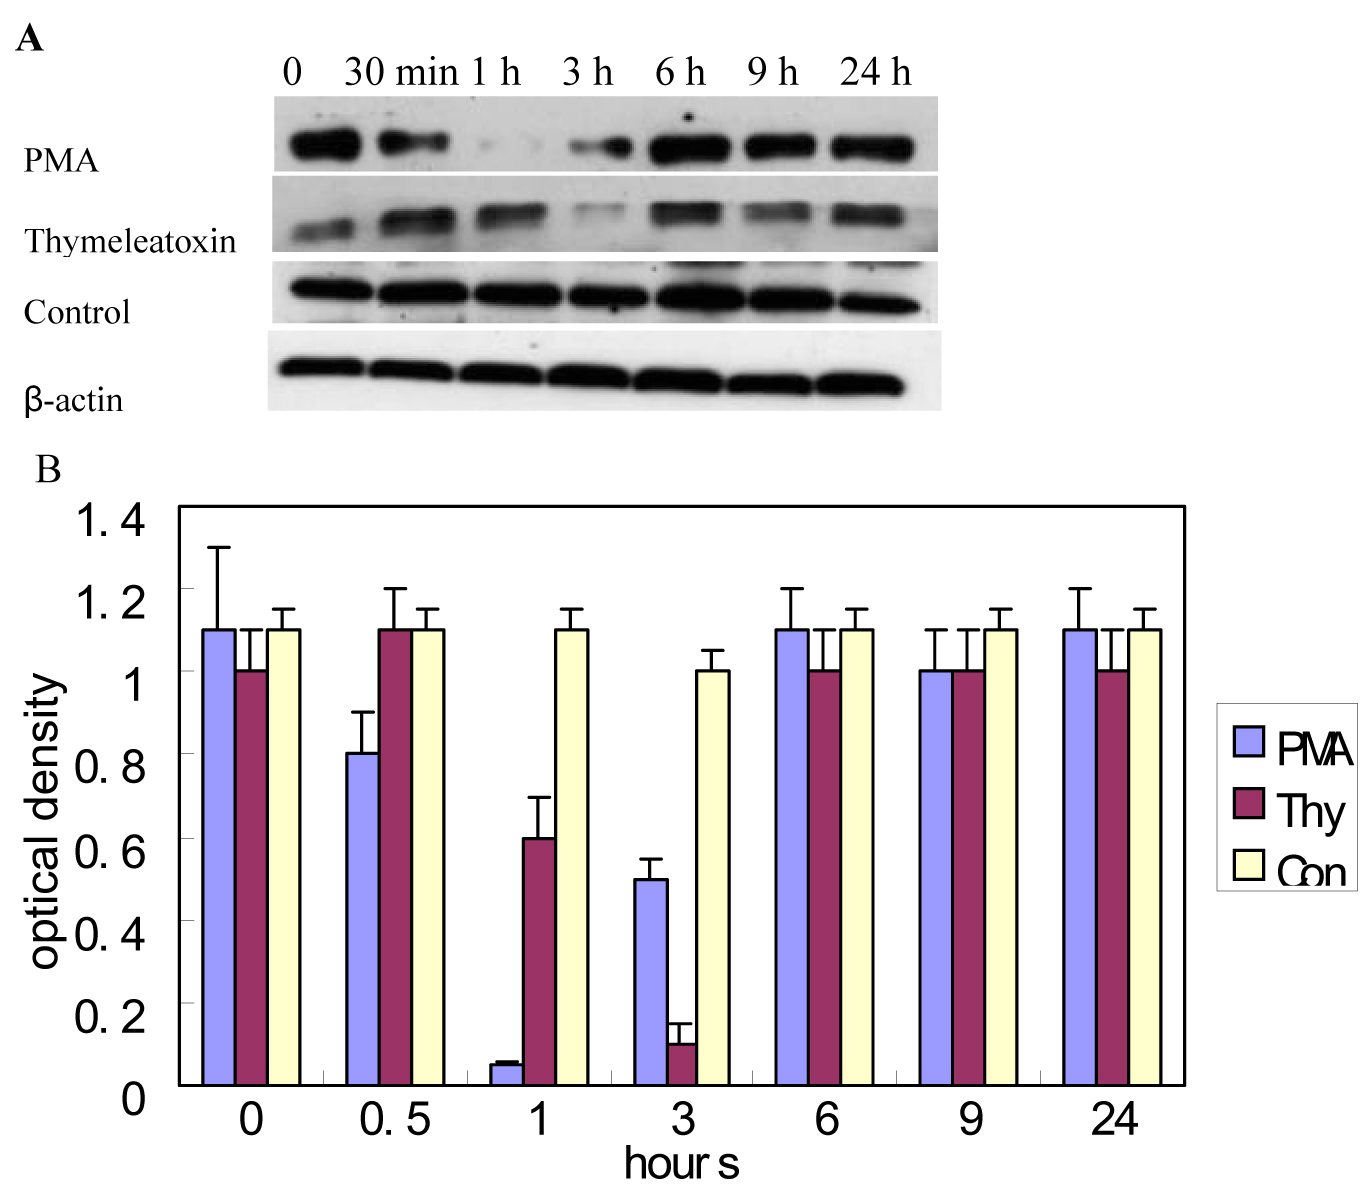
 Figure 5 of Gao, Mol Vis 2009; 15:2683-2695.