Figure 4. Downregulation of the p27Kip1
gene following PKCα activation. A: PKCα
mRNA level is downregulated at the 3 h point following 24 h of siRNA-PKCα
(lane 2) treatment, but not upregulated following PMA (lane 4) and
thymeleatoxi (lane 3) treatment. lane 1, control. B: p27kip1
mRNA level is downregulated following 3 h of PMA (lane 4) and
thymeleatoxi (lane 3) treatment and upregulated following siRNA-PKCα
(lane 2) treatment. lane 1, control. Five micrograms of RNA was used
for each reaction. C: RT–PCR analysis of RPE cells stimulated
with 24 h PMA and thymeleatoxin treatment shows a strong downregulation
of the p27 mRNA at 1, 2, and 6 h following PMA, or at 1 and 2 h
following thymeleatoxin treatment. D: Optical density of P27
mRNA determined by densitometric imaging is shown (Mean±SD, n=4). The
GAPDH band is used for quantitation.
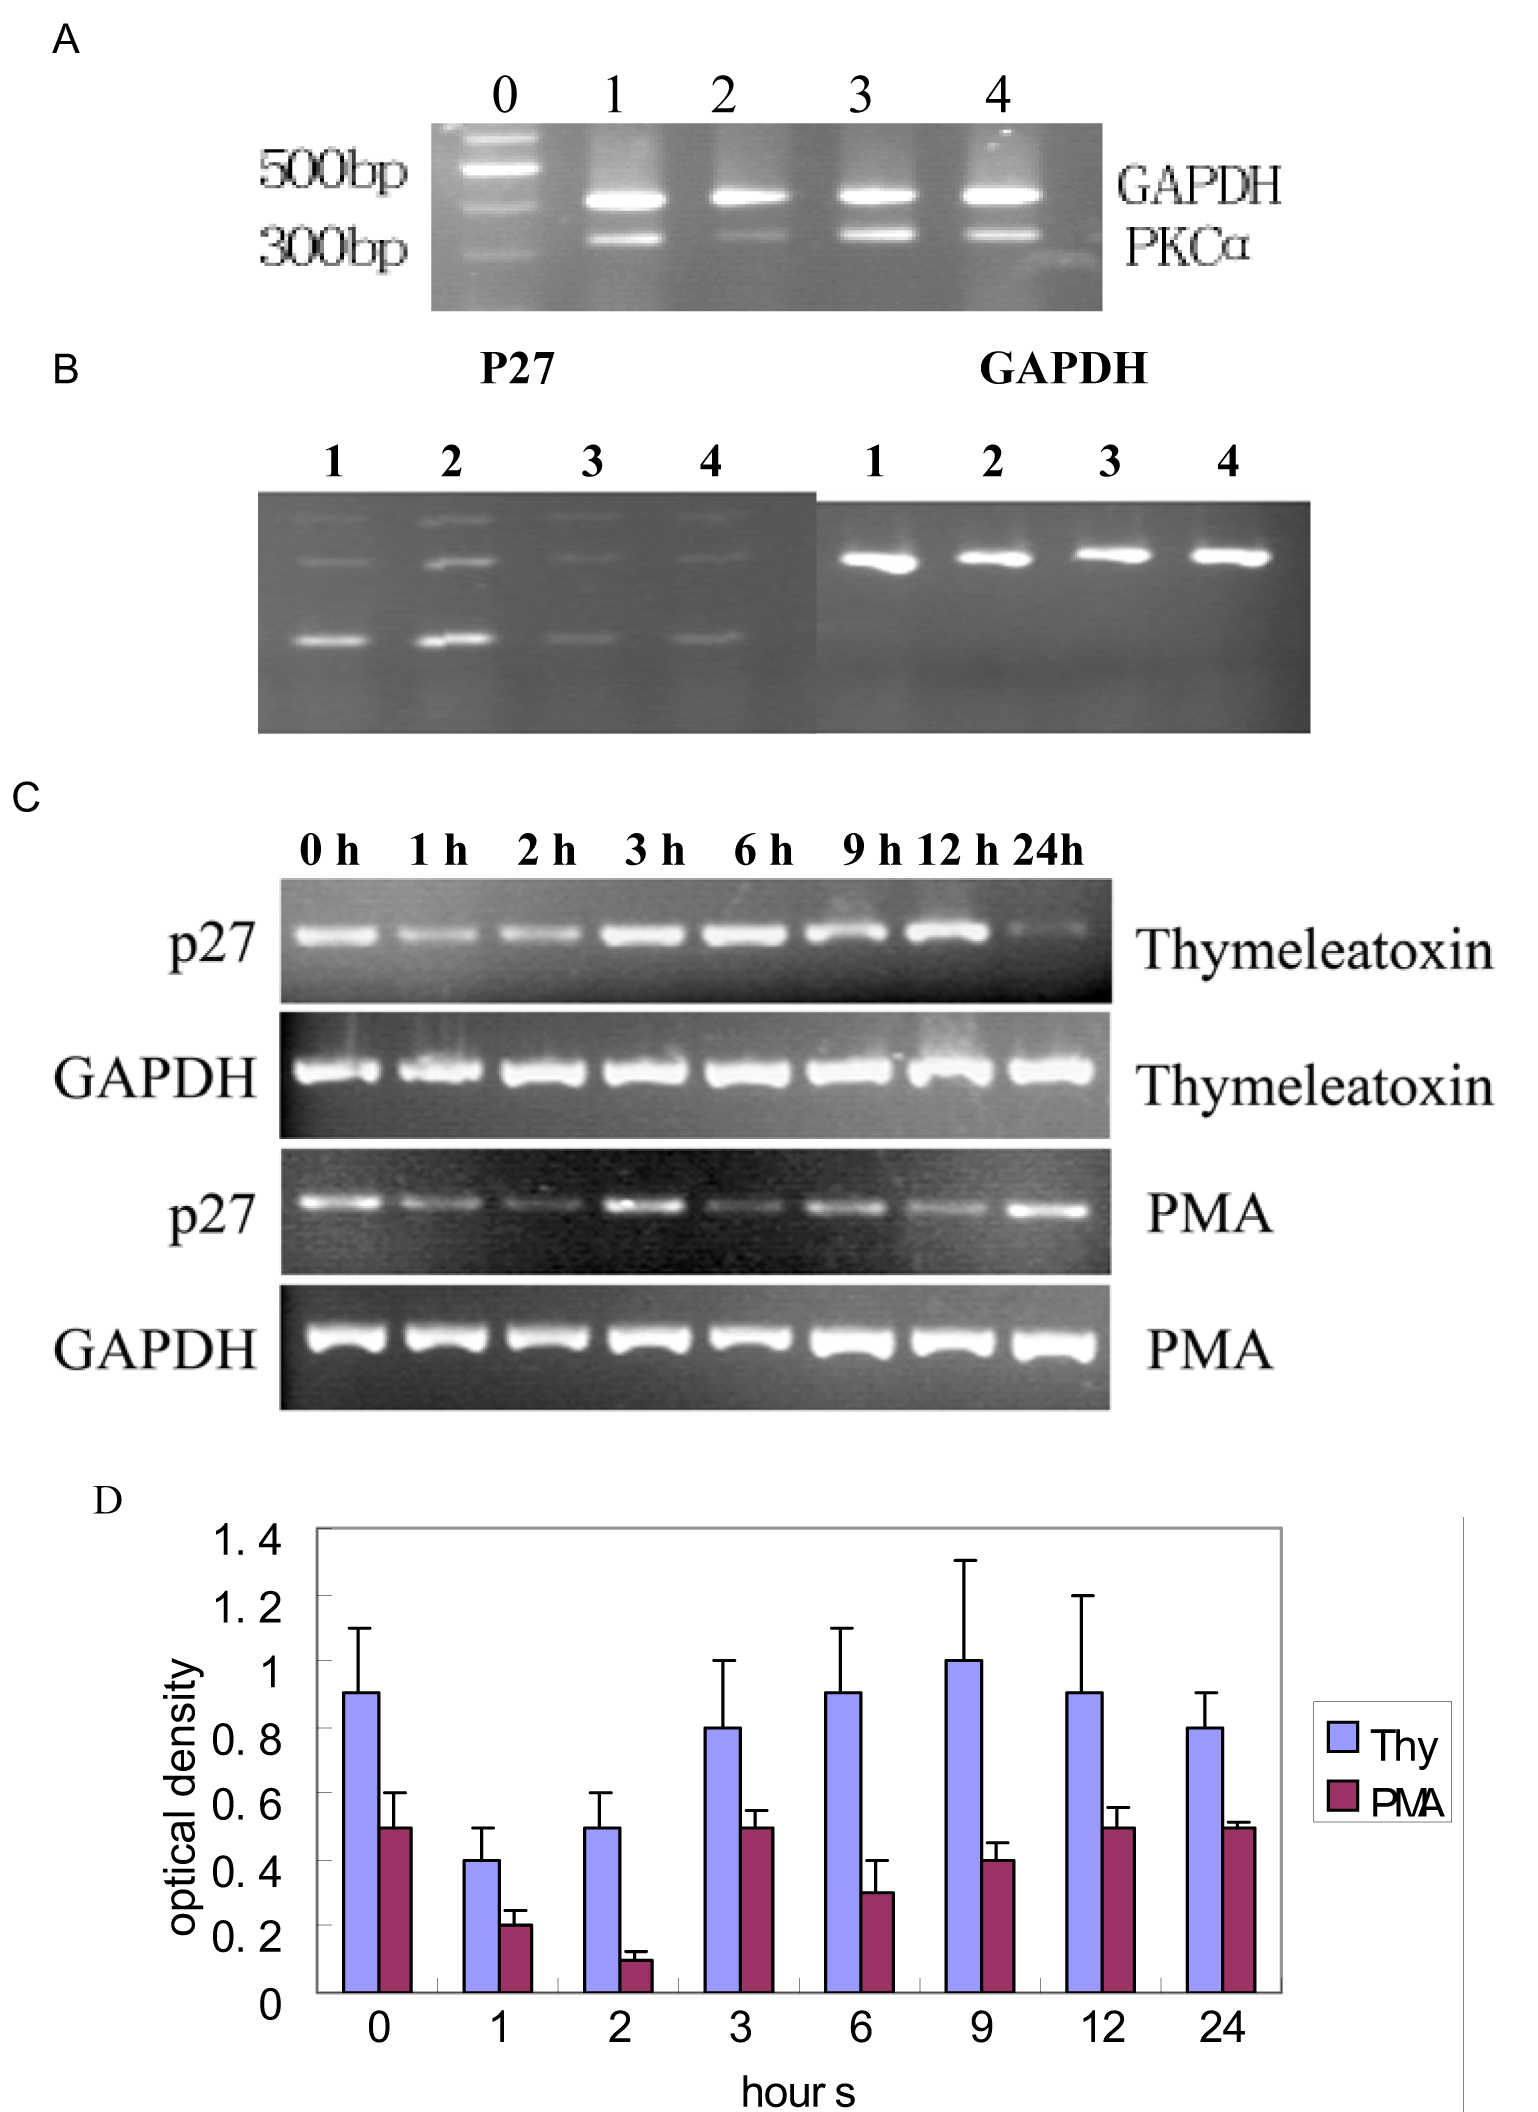
 Figure 4 of Gao, Mol Vis 2009; 15:2683-2695.