Figure 2. PKCα and PKCδ,
are
the only isoforms translocated by PMA in RPE cells. A:
Shown is a western blot analysis of the subcellular distribution
between cytosolic and membrane fractions of the nine PKC isoforms
expressed in RPE cells. RPE protein extracts were fractionated into
cytosolic (C) and particulate (P) fractions; 80 µg of protein was
loaded in each well. Only PKCα and PKCδ were
translocated in response to PMA. PKCδ was completely
downregulated by proteolytic degradation by 6 h of treatment, while PKCα
was translocated from the cytosolic to the particulate fraction from 3
h to 24 h. Note that in the doublet obtained for PKCδ, only
the upper band (78 kDa) is the active form of the enzyme. B:
Optical
density of PKCα determined by densitometric imaging
is shown (Mean±SD; n=4). The contents at different time points are
statistically different (F=2.337, p<0.05). The β-actin band with
42 kDa is used for quantitation.
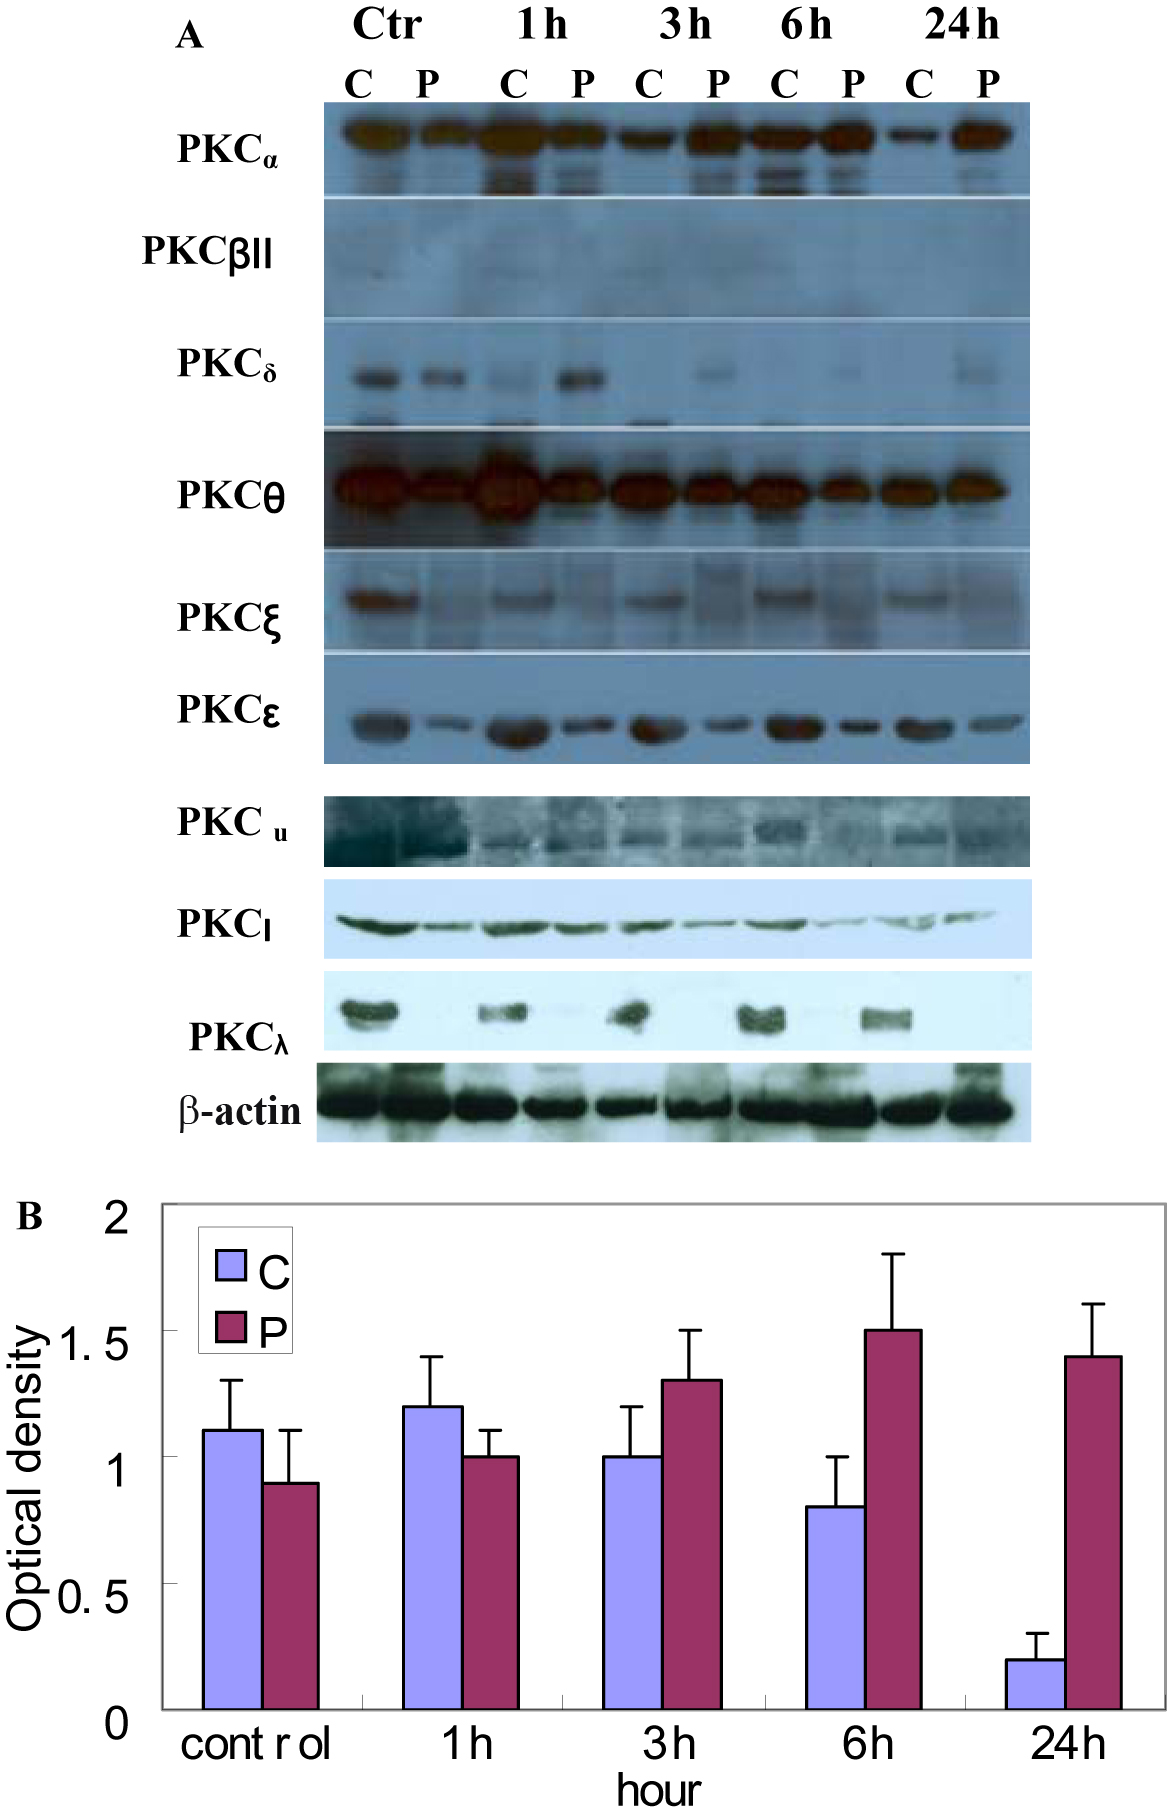
 Figure 2 of Gao, Mol Vis 2009; 15:2683-2695.