Figure 1. PKC activation with PMA affects
cell cycle in human RPE cells. Flow cytometry analysis of PMA-treated
RPE cells (A) shows decreased S phase and increased G2-M
phases
cell numbers when compared with that of untreated RPE cells (B).
For each side scatter plot, the y-axis is the number of cells,
while the x-axis is the DNA content. Values from each scatter
plot are graphed below panels A and B. Similar results
after PMA treatment were obtained in eight independent experiments. C:
Immunofluorescence
of cellular DNA stained with propidium iodide (PI)
showed cells in interphase or at different stages of mitosis. RPE cells
were grown on glass coverslips for 24 h, treated either with PMA or
with thymeleatoxin for 9 h, and then fixed.
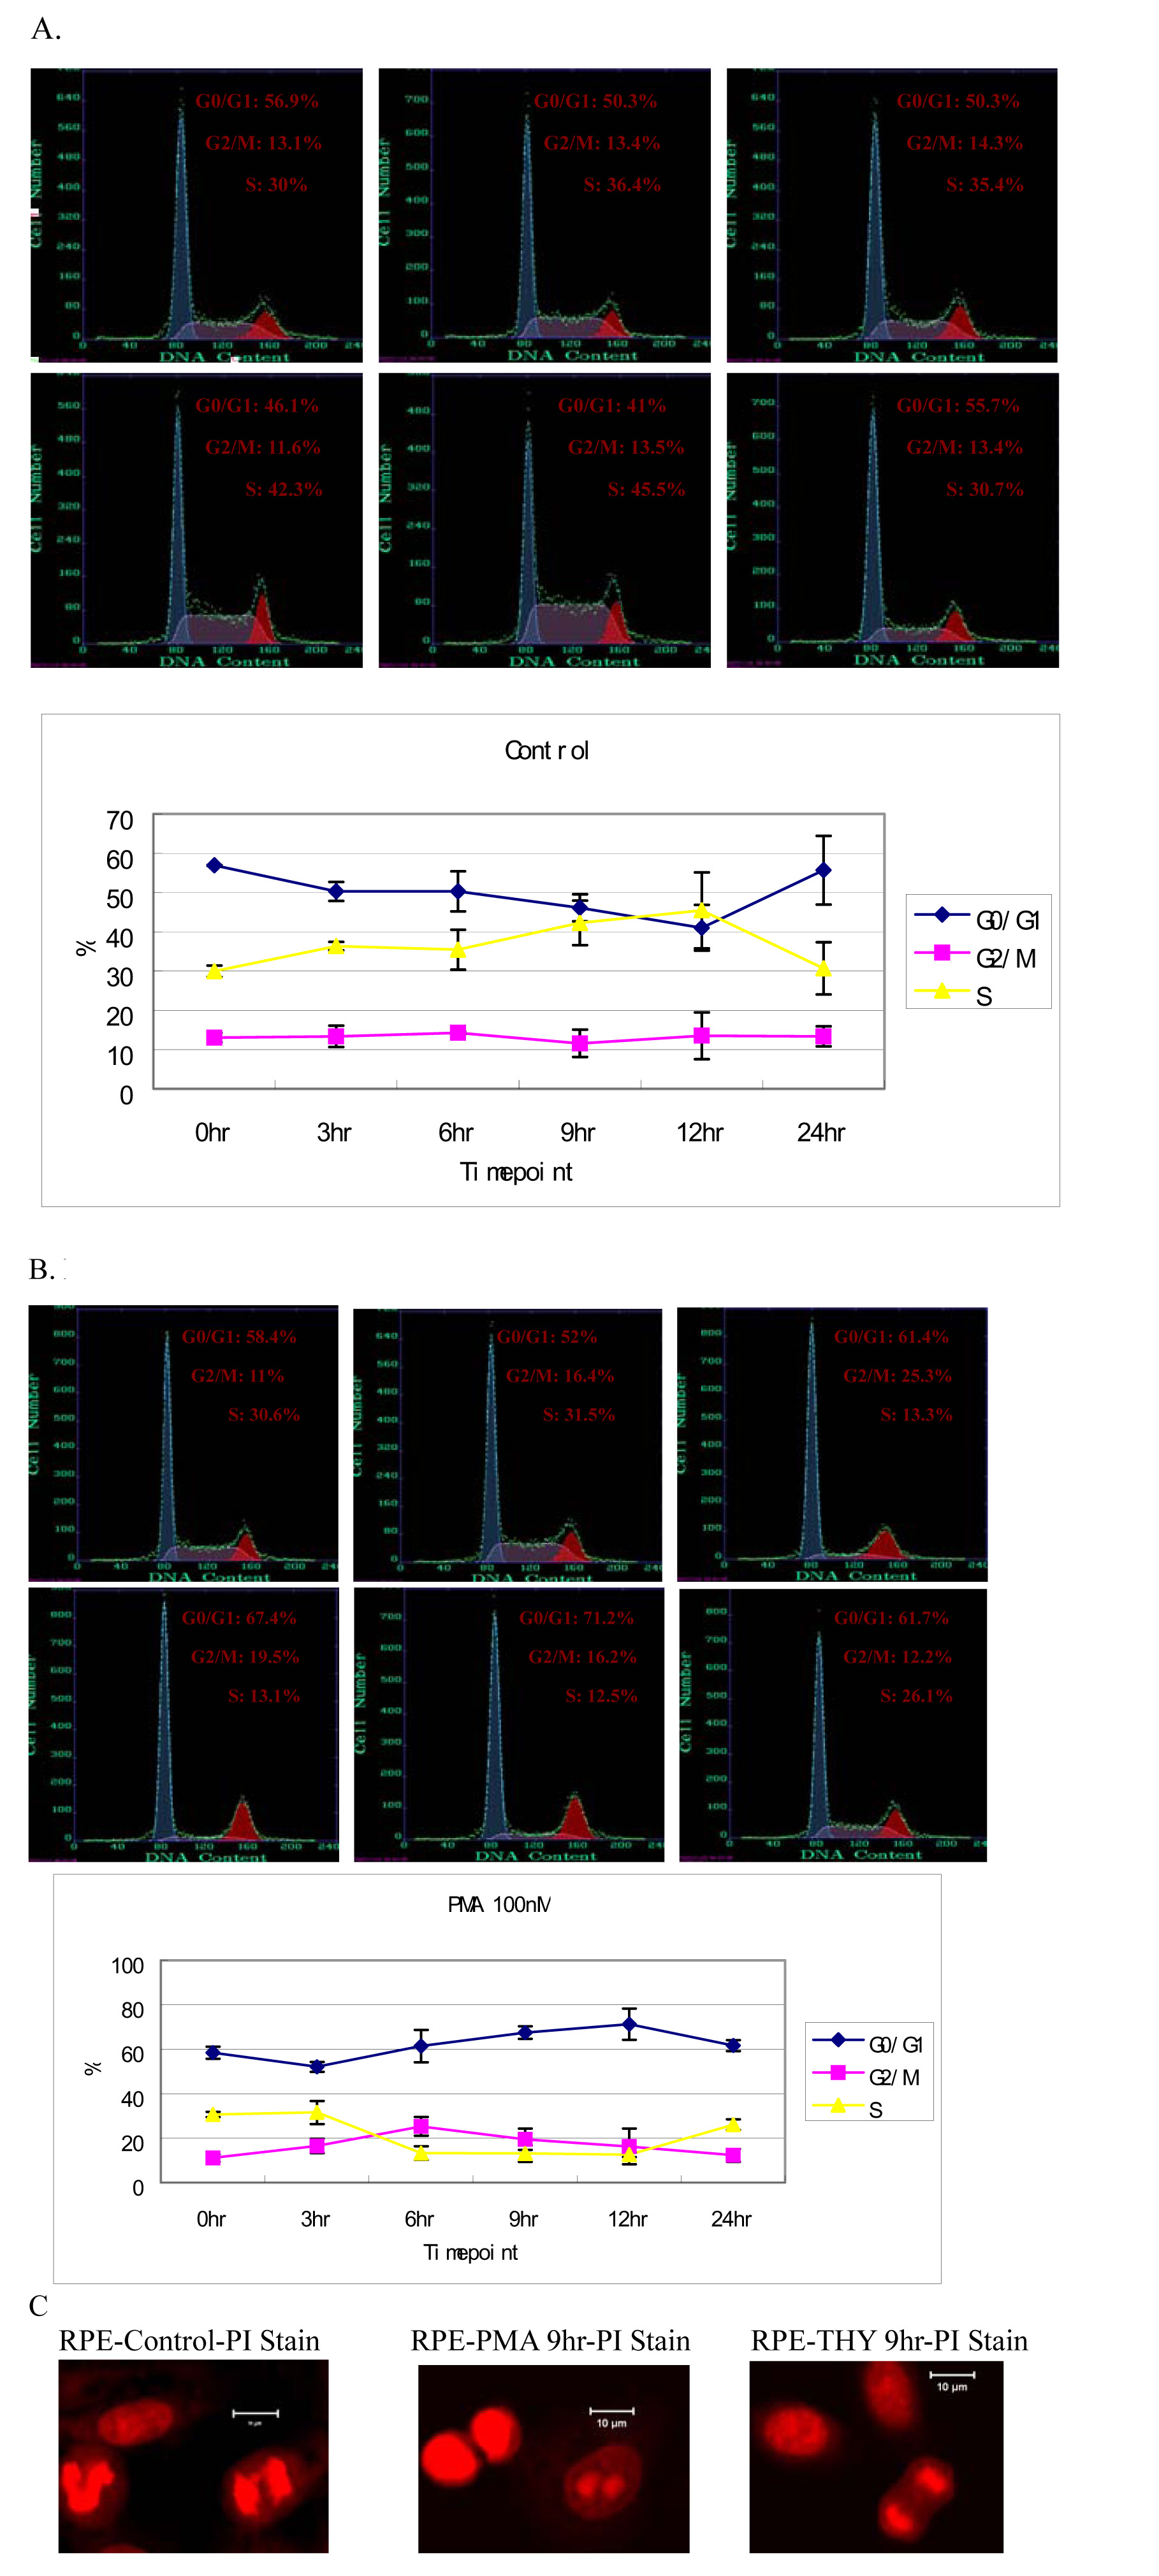
 Figure 1 of Gao, Mol Vis 2009; 15:2683-2695.