Figure 1. Structure of linkage
disequilibrium (LD) plotted for eight SNPs in the TLR4 gene.
The D’ value and r2 value (in parentheses) that correspond
to each SNP pair are expressed as a percentage and shown within the
respective square. The gradient of D’ values (low to high values) is
indicated by different shades of red (light to dark, respectively). The
eight SNPs constitute a haplotype block that spans 24 kb of TLR4.
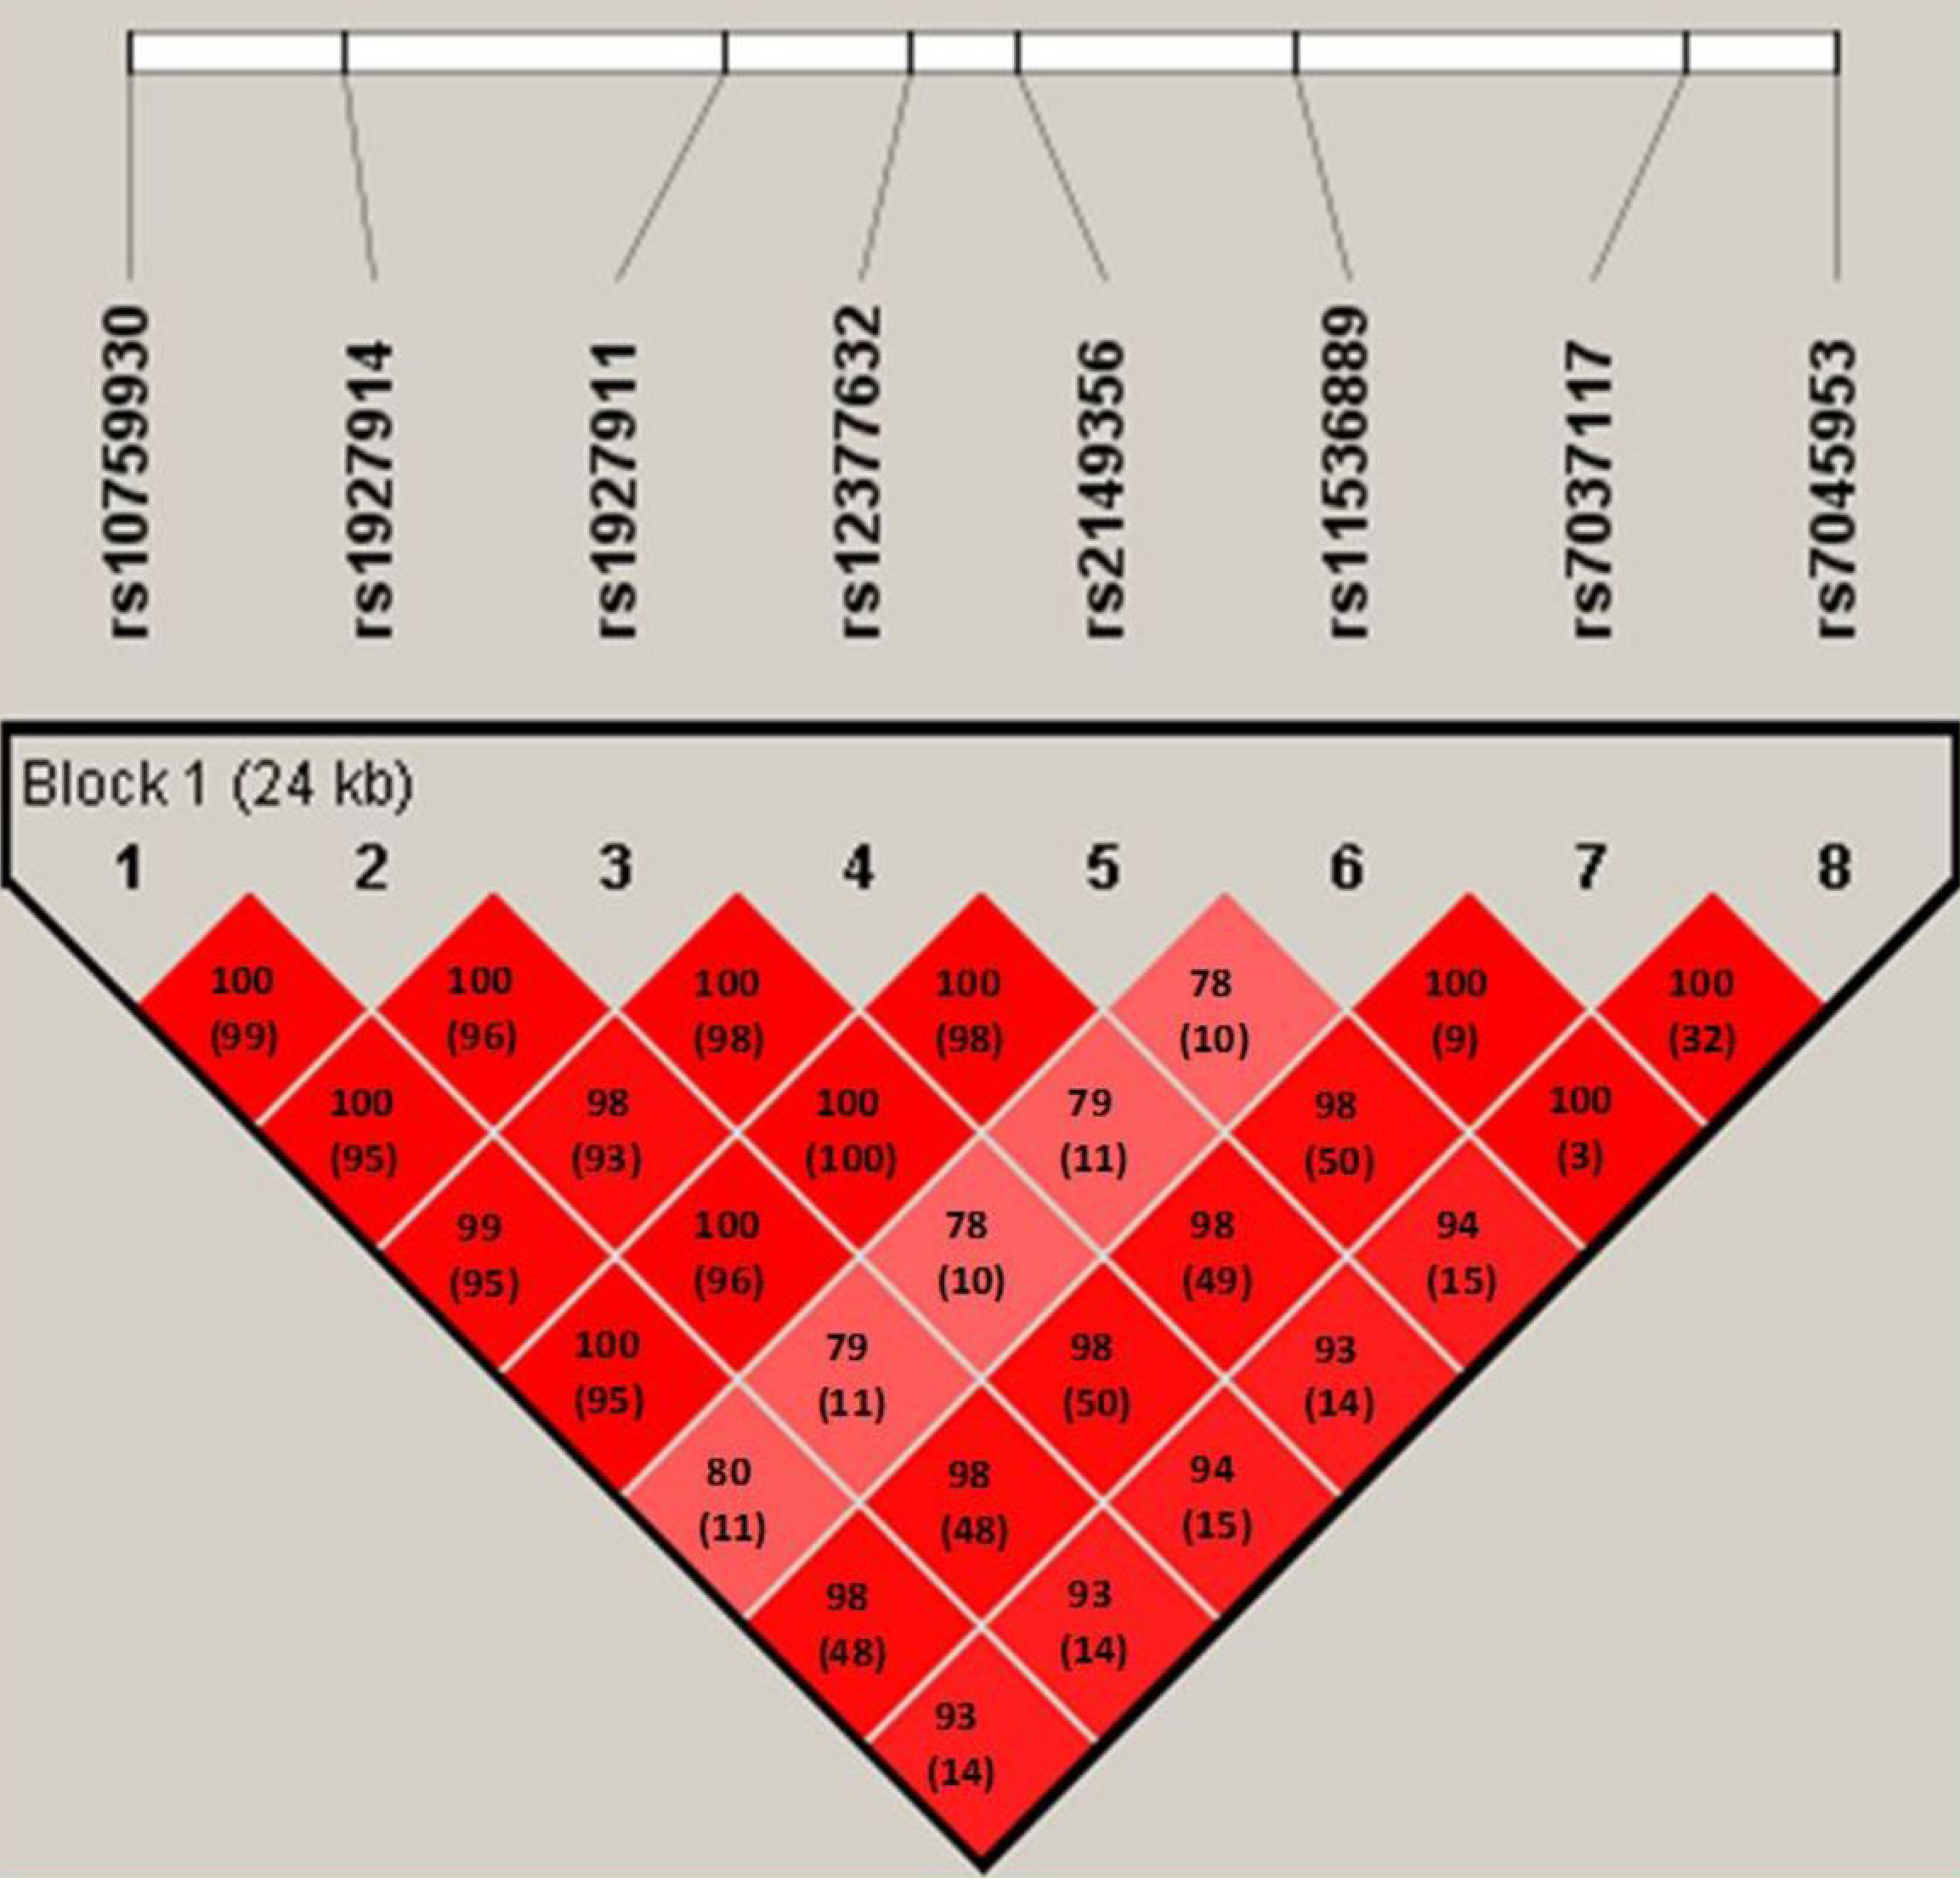
 Figure 1 of Asukata, Mol Vis 2009; 15:2673-2682.