Figure 5. Effects of EC-SOD against
VEGF-induced cell proliferation and migration in HUVECs and HRMVECs. In
the proliferation assay, (A) HUVECs and (B) HRMVECs were
incubated with 10 ng/ml VEGF with or without 100 ng/ml EC-SOD for 72 h.
EC-SOD significantly suppressed VEGF-induced proliferation in HUVECs
and HRMVECs. Data represent means and standard error. The number of
Control group (n=12), EC-SOD alone (n=12), VEGF alone (n=18), and VEGF
plus EC-SOD (n=18). The value of “Control” defines as 100%. Double
sharp (##) denotes p<0.01 versus Control based on the Tukey test.
Asterisk (*) and double asterisk (**) denotes p<0.05 and p<0.01
versus VEGF alone based on the Tukey test. C, D: HUVECs
and (E) HRMVECs migration were assessed using a wound-healing
assay. Briefly, 90% confluent monolayer cells were scratch-wounded,
then incubated for 24 h. Images of this type of wounded monolayer are
shown for 0 h and 24 h after treatment with 10 ng/ml VEGF with or
without 100 ng/ml EC-SOD. C: These pictures indicated the
migration cells after stimulated VEGF with or without EC-SOD in HUVECs.
Scale bar represents 250 µm. Horizontal lines indicate wound edges. D,
E: EC-SOD had no effect by itself, and no effect on VEGF-induced
migration (versus VEGF alone) in HUVECs and HRMVECs. Data represent
means and standard error (n=4). Double sharp (##) denotes p<0.01
versus Control based on the Tukey test.
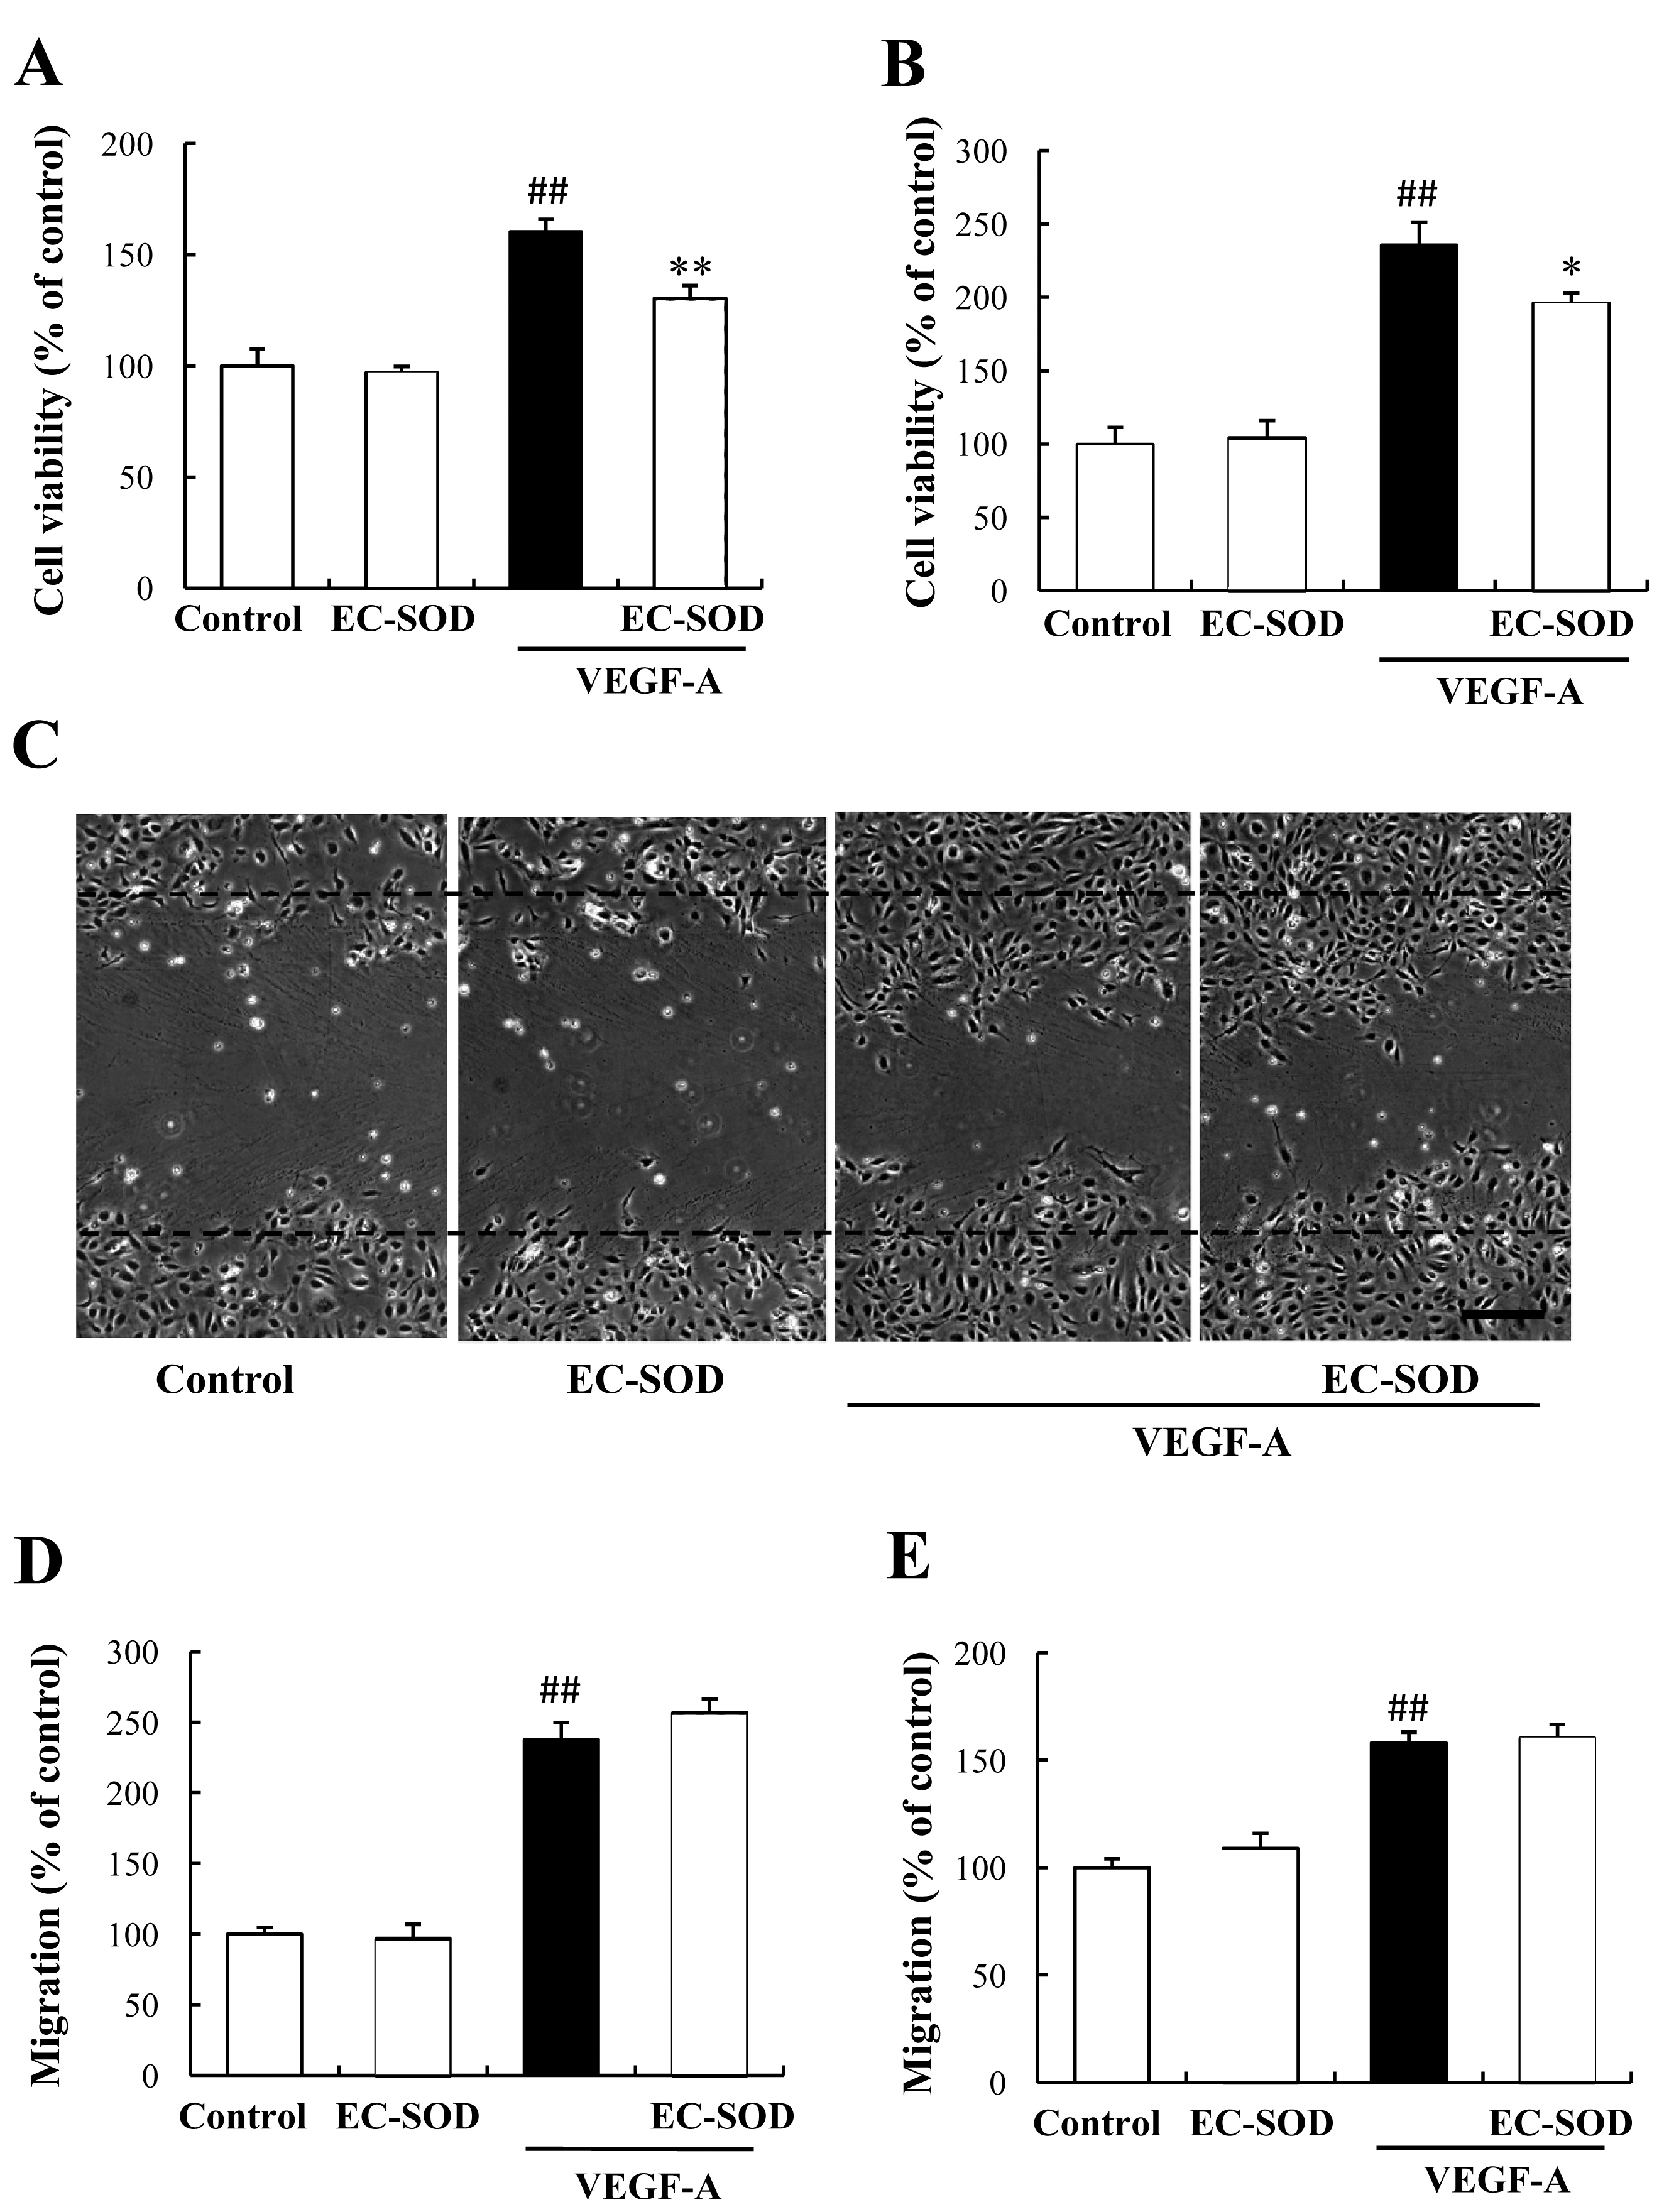
 Figure 5 of Izuta, Mol Vis 2009; 15:2663-2672.