Figure 3. Correlations between EC-SOD and
VEGF levels (for vitreous body and serum). A: Intravitreal
EC-SOD showed a significant correlation with intravitreal VEGF. The
correlation coefficient was 0.61, and the p value was p<0.001. B:
In
the serum, there was no significant correlation between EC-SOD and
VEGF. For vitreous body data, open circles represent MH patients and
closed circles indicate PDR patients. For serum data, open triangles
represent MH patients and closed triangles indicate PDR patients.
Correlations were examined using Spearman rank-correlation coefficient,
and the number of each group was follow: the vitreous samples of PDR
(n=14) and MH (n=14), the serum samples of PDR (n=9) and MH (n=9).
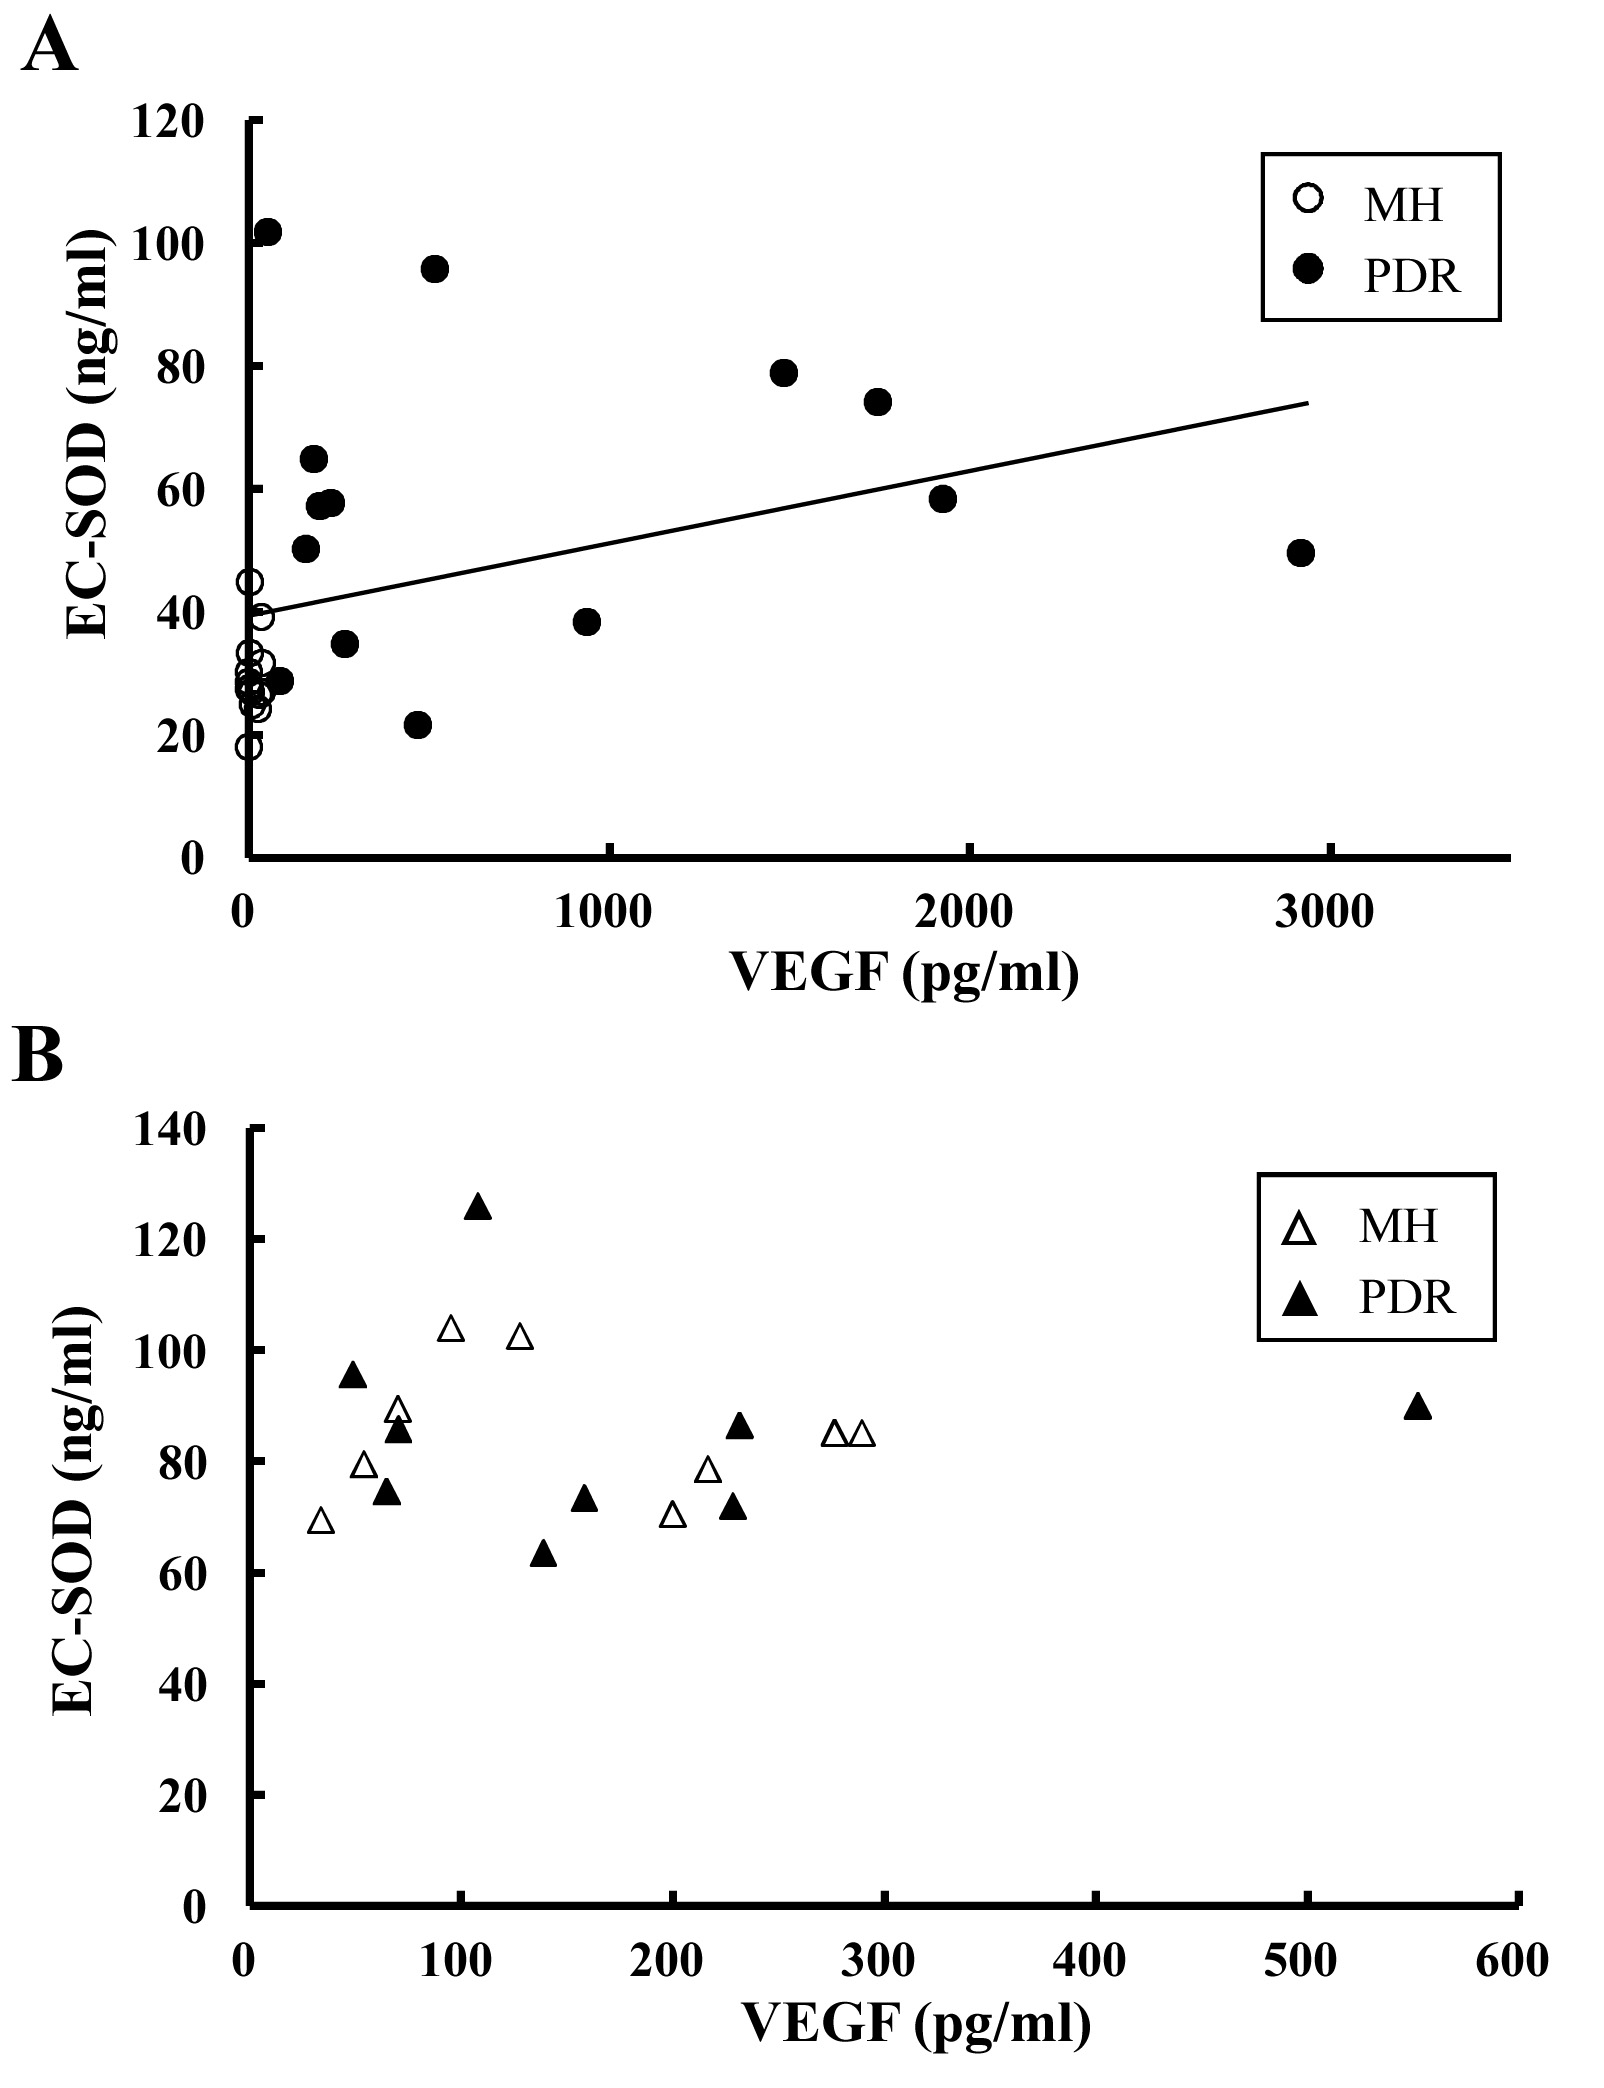
 Figure 3 of Izuta, Mol Vis 2009; 15:2663-2672.