Figure 1. EC-SOD levels in vitreous body
and serum samples from PDR and MH patients. In the vitreous body from
PDR patients, there was abundant EC-SOD compared to vitreous bodies
from MH patients. In contrast, the serum concentration of EC-SOD was
not significantly different between the two groups. Double asterisk
(**) denotes p<0.01 based on the Kruskal–Wallis test.
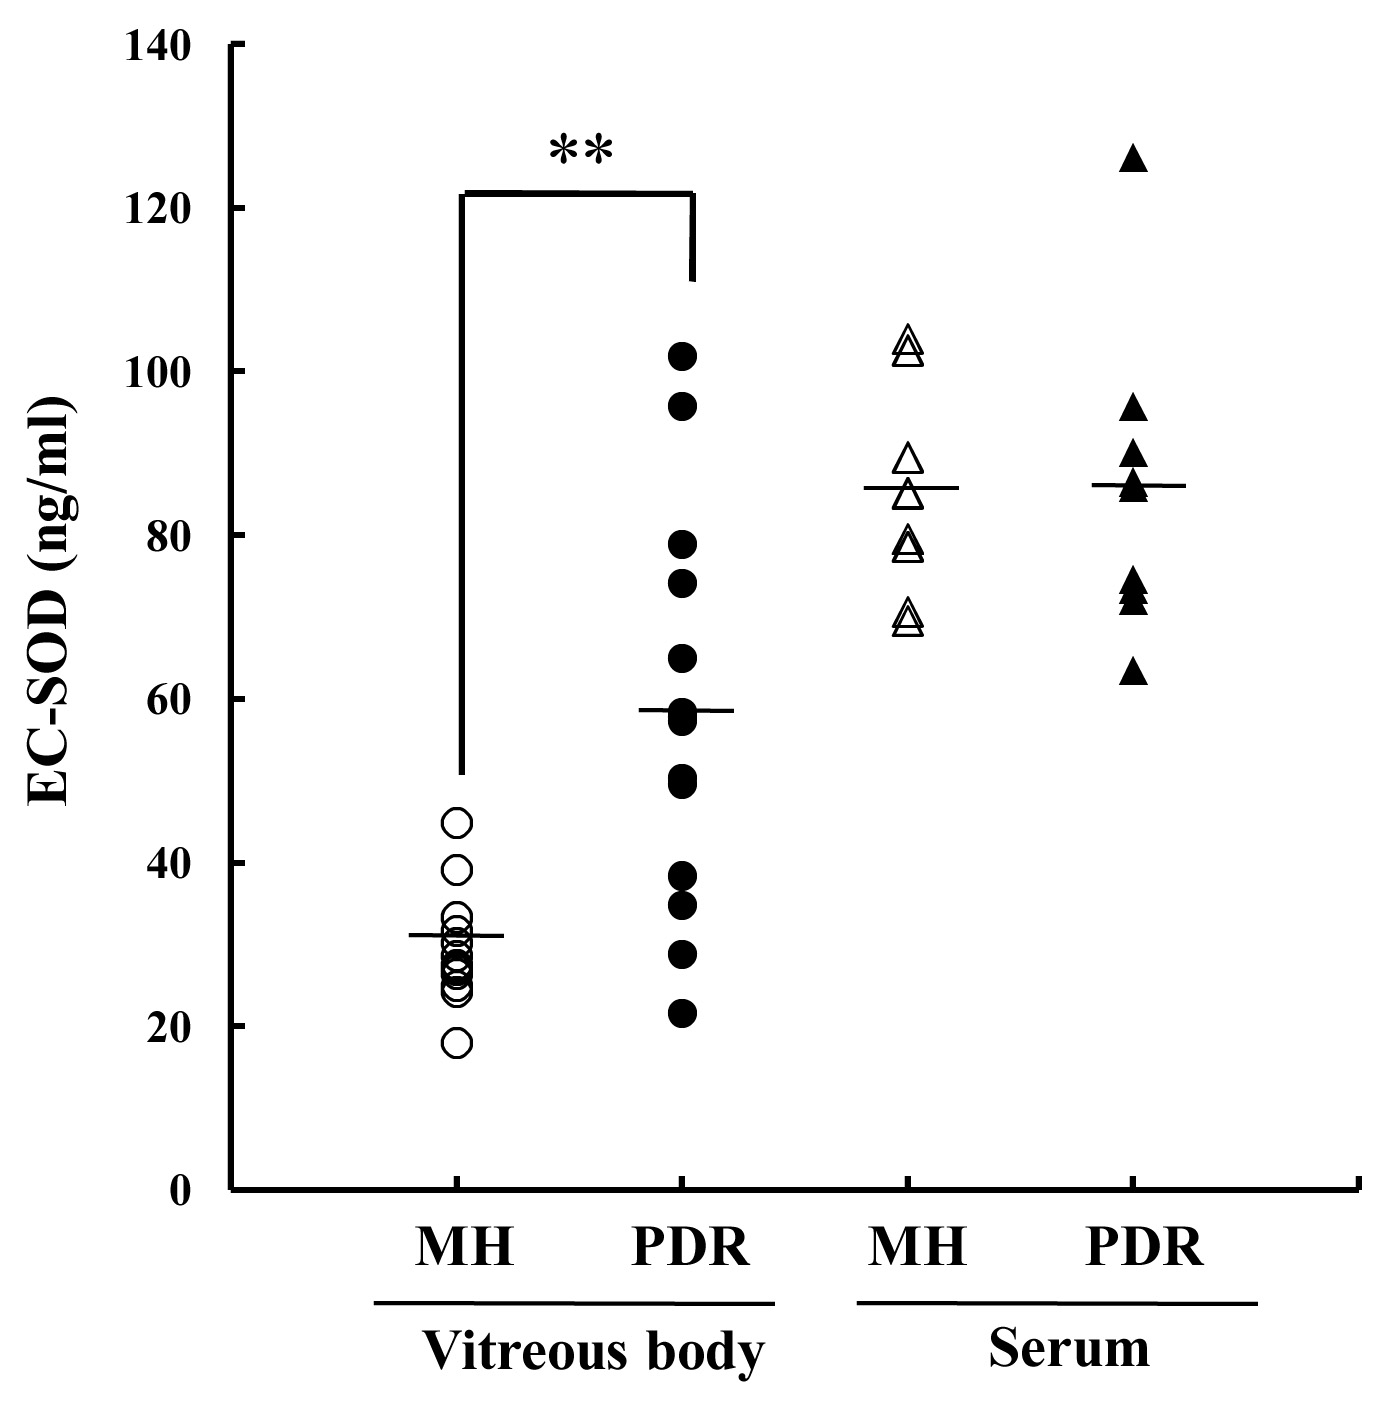
 Figure 1 of Izuta, Mol Vis 2009; 15:2663-2672.