Figure 5. Mean optical densitometry
measures of Eph-A6 mRNA expression in the ganglion cell layer.
Densitometry was performed at five sample locations (schematic) in
eight retinas of different ages (one section quantified at each age).
Note that the levels of expression (y-axis) are in arbitrary units, and
not directly comparable between animals. The data show that the
relative levels of Eph-A6 at the five sample locations change
between Fd 55 and Fd 80, but that by Fd 110 a pattern of
expression is established where peak levels of Eph-A6 mRNA are
detected in the ganglion cell layer (GCL) at the fovea. There is a
gradual decline in expression levels at locations increasingly distant
from the fovea. Levels of mean Eph-A6 optical densitometry
measures were significantly different between foveal and nasal
locations at all ages (Mann–Whitney, p<0.0001), where n=number of
lines of pixels of the image analyzed (see Methods). Note that the Fd
55 section did not pass through the optic disc (OD).
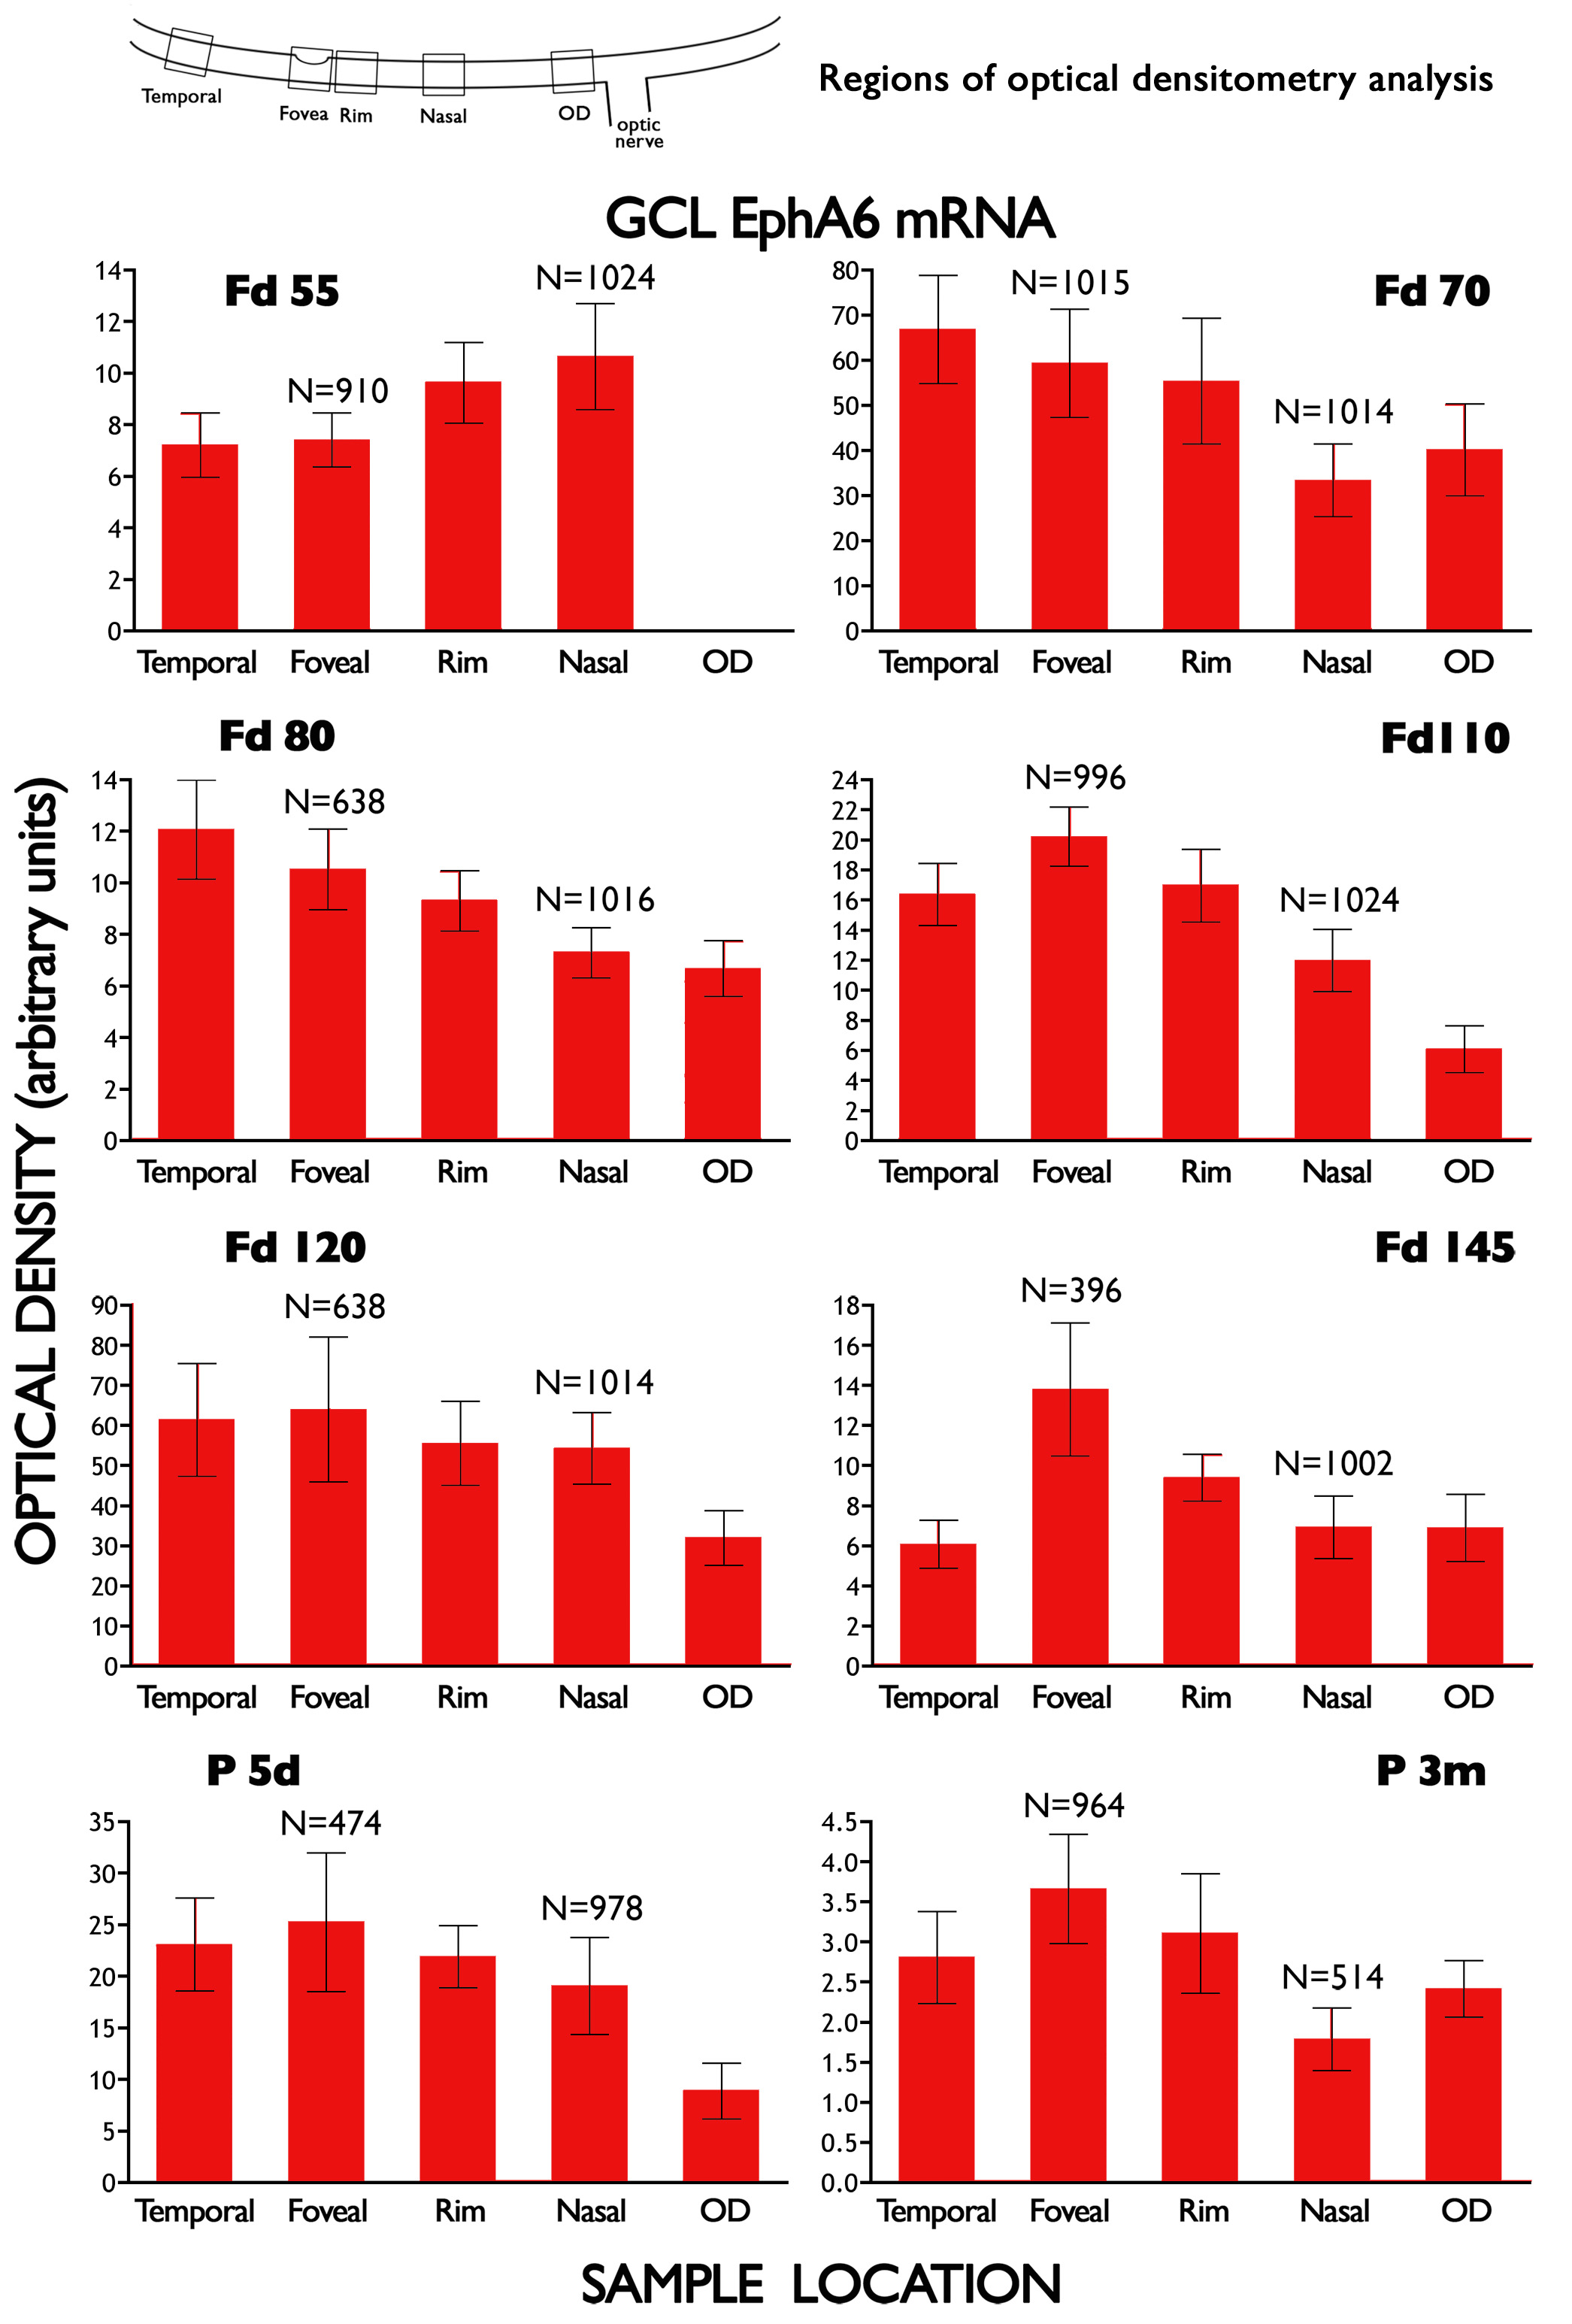
 Figure 5 of Kozulin, Mol Vis 2009; 15:2649-2662.