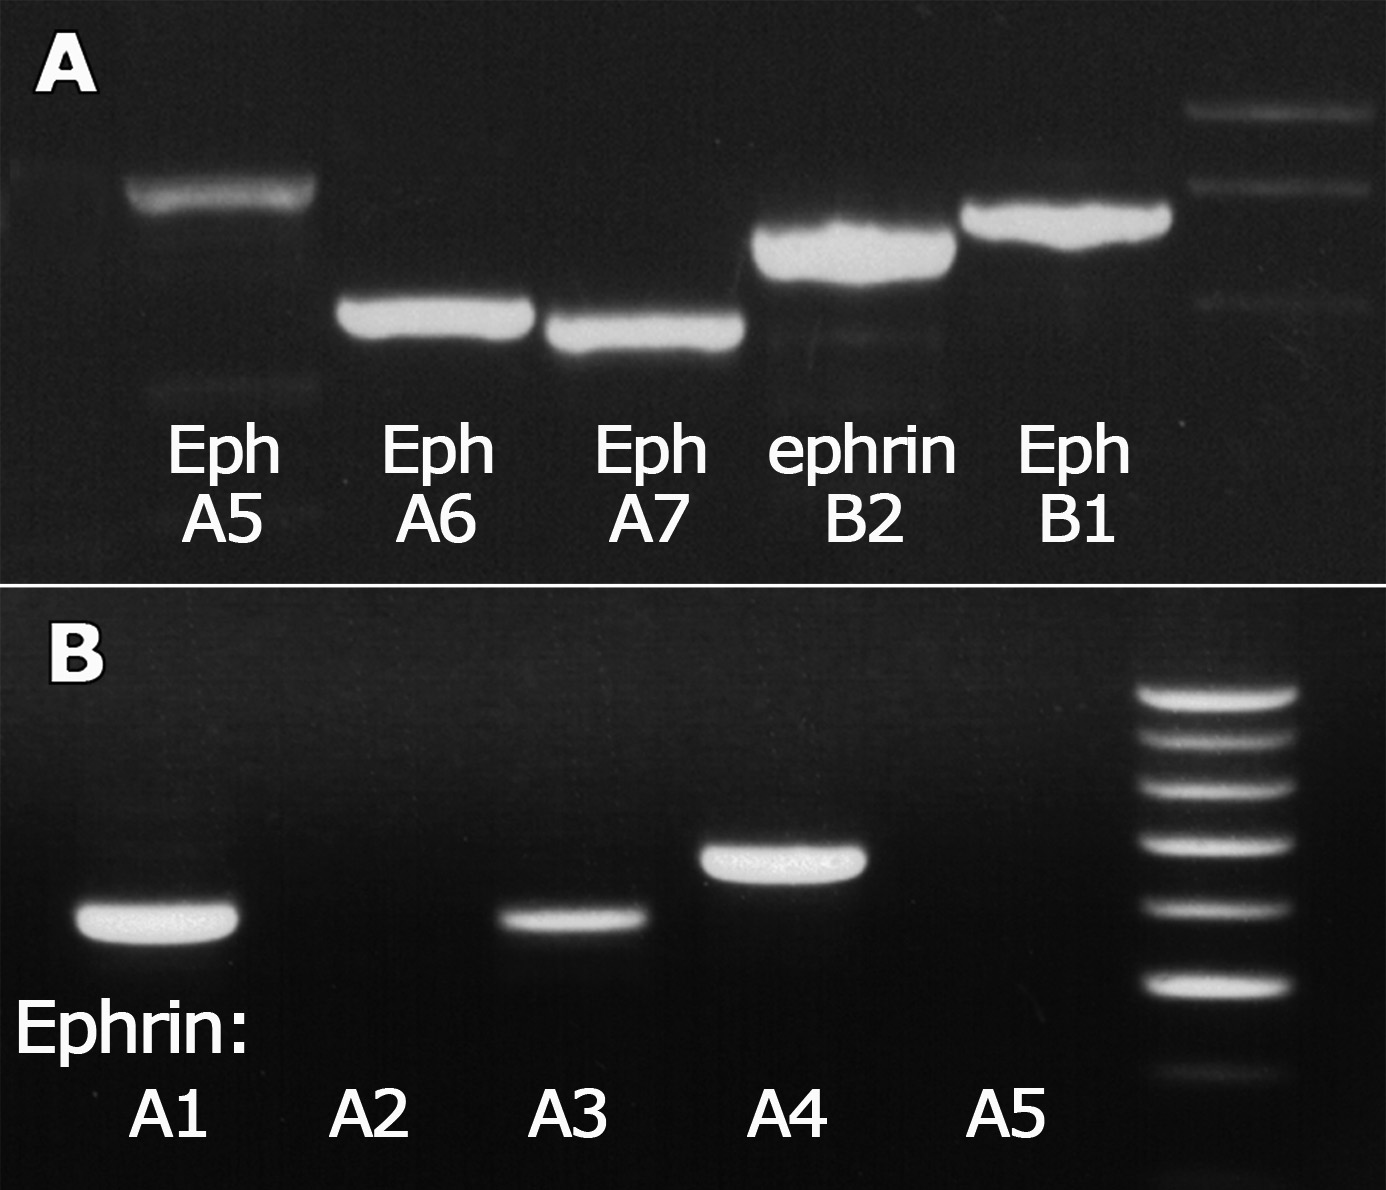
Figure 1. RT–PCR analysis of Eph and
ephrin expression in 20 WG fetal human retina.
A: We found low
levels of amplification of
Eph-A5, and (
B) no
amplification of
ephrin-A2 and
-A5. Eph and ephrin PCR
primers are listed in
Table 1. PCR products were
visualized with electrophoresis using ethidium bromide staining on a 1%
agarose gel, and used to generate DIG labeled riboprobes for
Eph-A5,
-A6, -B1, -A7, and
ephrin-A1, -A4, and
-B2.
 Figure 1 of Kozulin, Mol Vis 2009; 15:2649-2662.