Figure 5. Cytochrome C release in TA treated BRECs. Absence of cytochrome C release in triamcinolone acetonide (TA)-treated BRECs. Control
cells are shown in A to C. TA treated cells for 72 h are shown in D to F and for 5 days in G to I. No cytochrome C release is seen in these cells. Compare to cells treated with staurosporin (Stp) used as positive control
(J-L, arrow in K and L). Nuclei were stained with DAPI (A, D, G, J). Scale bar represents 50 µm.
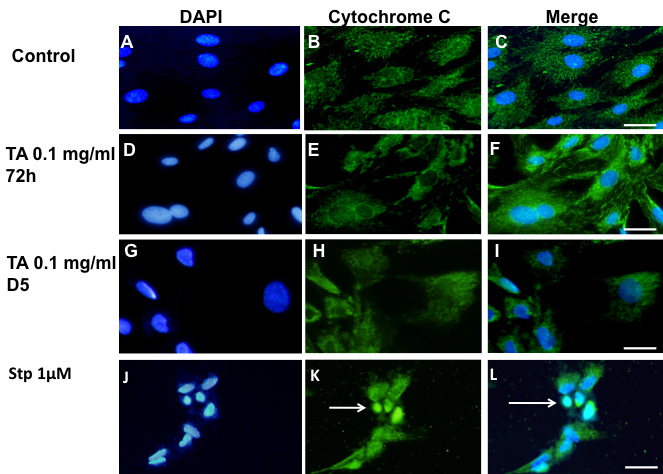
 Figure 5 of
Valamanesh, Mol Vis 2009; 15:2634-2648.
Figure 5 of
Valamanesh, Mol Vis 2009; 15:2634-2648.