Figure 3. Annexin V binding of TA treated BRECs. Annexin-V binding was performed in control cells, treated with 1% ethanol (the TA vehicle;
A-C) or with 0.1% TA for 72 h (D-F) or five days (G-I). Condensed nuclei are seen in TA treated cells (D and G, squares) as well as Annexin-V positive cells (E and H, squares). Arrows indicates Annexin-V positive cells. Scale bar represents 50 µm.
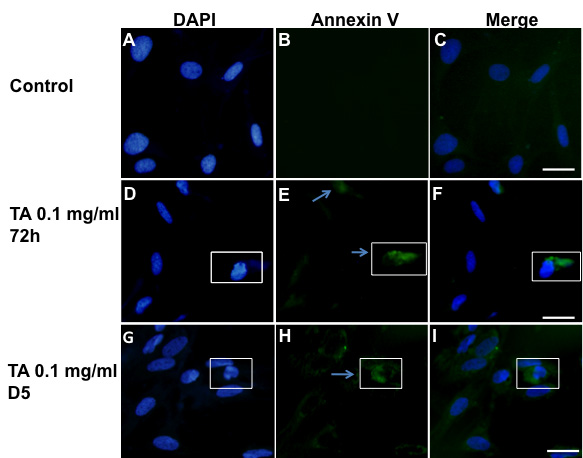
 Figure 3 of
Valamanesh, Mol Vis 2009; 15:2634-2648.
Figure 3 of
Valamanesh, Mol Vis 2009; 15:2634-2648.