Figure 11. COX-2 and VEGF mRNA expression in RPE cells treated with TA. COX-2 (A) and VEGF (B) mRNA expression (real time quantitative PCR) in untreated control primary rat RPE cells (C), or in RPE cells exposed to triamcinolone acetonide (TA), outer segments (OS) or both (OS-TA). Results are expressed as
mean±standard error with *p<0.05, ***p<0.001, when considering all columns versus control in (B) and in (A) *p<0.05 OS-TA versus OS. Four animals were used in each study.
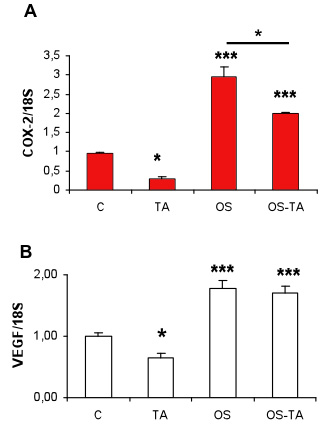
 Figure 11 of
Valamanesh, Mol Vis 2009; 15:2634-2648.
Figure 11 of
Valamanesh, Mol Vis 2009; 15:2634-2648.