Figure 1. Effect of triamcinolone acetonide on BRECs viability and proliferation. Cell viability was evaluated using an MTT assay. Subconfluent
(A) or confluent BRECs (B) were exposed to 0.1 or 1 mg/ml TA in 1% ethanol for 24 h (dark-gray columns), 72 h (red columns), or five days (white columns).
Control cells were either exposed to 1% ethanol (C-E) or were left untreated (C). C: Cell proliferation was evaluated using BrdU labeling detection after 24 h of treatment with 0.1 mg/ml or 0.5 µg/ml TA. Control
cells were either left untreated (C) or were treated with 1% ethanol (C-E). Results are expressed as mean±standard error; with *p<0.05 for all columns versus control. Four animals were used in each
experiment. DAPI staining of untreated control cells are shown in (D), 0.1 mg/ml TA-treated cells in (E) and 1 mg/ml TA-treated cells in (F), all of them after five days of treatment. Scale bar represents 50 µm.
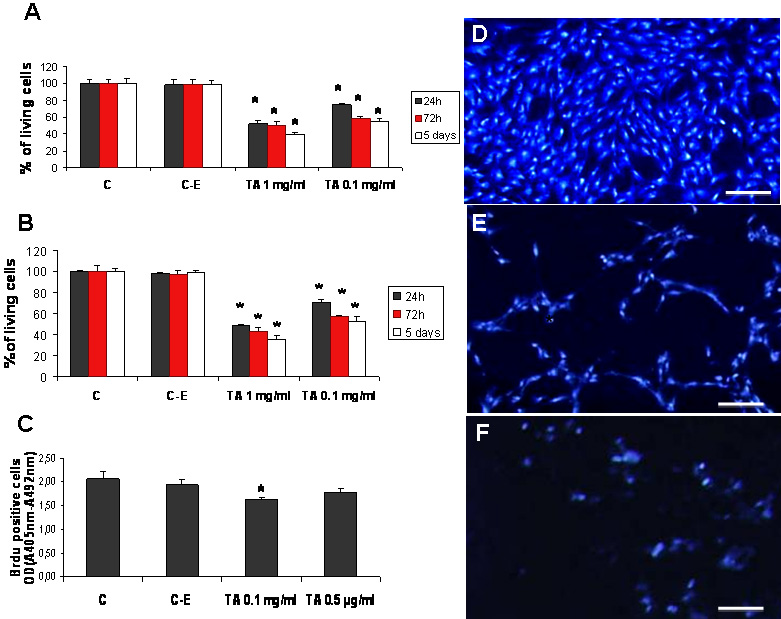
 Figure 1 of
Valamanesh, Mol Vis 2009; 15:2634-2648.
Figure 1 of
Valamanesh, Mol Vis 2009; 15:2634-2648.