Figure 2. Linkage disequilibrium (LD) map
for the 16 tSNPs genotyped for MET in the current study. Each
diamond represents the correlation (r2) between each pair of SNPs with
darker shades representing stronger linkage disequilibrium. The linkage
disequilibrium block structure for the HapMap CEPH trios is indicated.
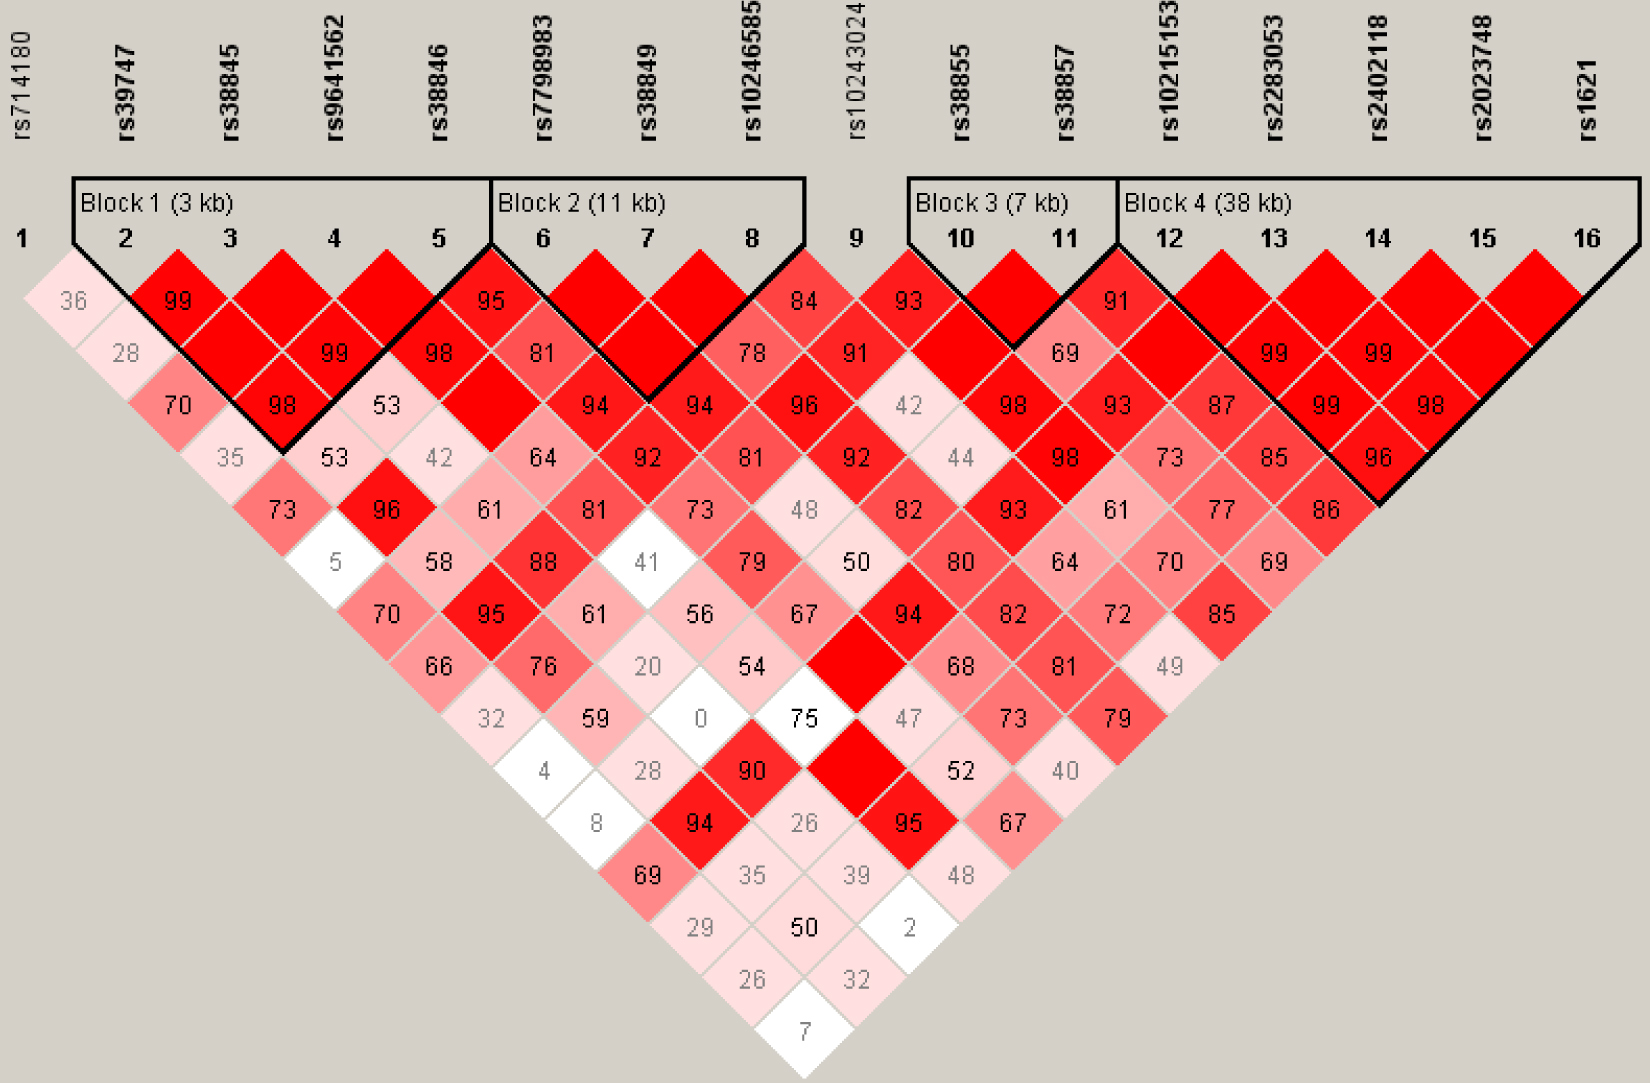
 Figure 2 of Schache, Mol Vis 2009; 15:2599-2605.